

Annual Energy Outlook 2006 with Projections to 2030 - Usinfo.org
Annual Energy Outlook 2006 with Projections to 2030 - Usinfo.org
Annual Energy Outlook 2006 with Projections to 2030 - Usinfo.org

You also want an ePaper? Increase the reach of your titles
YUMPU automatically turns print PDFs into web optimized ePapers that Google loves.
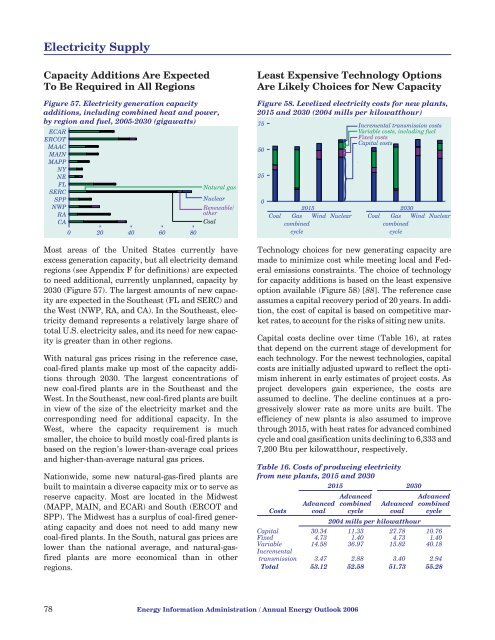
Electricity SupplyCapacity Additions Are ExpectedTo Be Required in All RegionsFigure 57. Electricity generation capacityadditions, including combined heat and power,by region and fuel, 2005-<strong>2030</strong> (gigawatts)ECARERCOTMAACMAINMAPPNYNEFLSERCSPPNWPRACA0 20 40 60 80Natural gasNuclearRenewable/otherCoalMost areas of the United States currently haveexcess generation capacity, but all electricity demandregions (see Appendix F for definitions) are expected<strong>to</strong> need additional, currently unplanned, capacity by<strong>2030</strong> (Figure 57). The largest amounts of new capacityare expected in the Southeast (FL and SERC) andthe West (NWP, RA, and CA). In the Southeast, electricitydemand represents a relatively large share of<strong>to</strong>tal U.S. electricity sales, and its need for new capacityis greater than in other regions.With natural gas prices rising in the reference case,coal-fired plants make up most of the capacity additionsthrough <strong>2030</strong>. The largest concentrations ofnew coal-fired plants are in the Southeast and theWest. In the Southeast, new coal-fired plants are builtin view of the size of the electricity market and thecorresponding need for additional capacity. In theWest, where the capacity requirement is muchsmaller, the choice <strong>to</strong> build mostly coal-fired plants isbased on the region’s lower-than-average coal pricesand higher-than-average natural gas prices.Nationwide, some new natural-gas-fired plants arebuilt <strong>to</strong> maintain a diverse capacity mix or <strong>to</strong> serve asreserve capacity. Most are located in the Midwest(MAPP, MAIN, and ECAR) and South (ERCOT andSPP). The Midwest has a surplus of coal-fired generatingcapacity and does not need <strong>to</strong> add many newcoal-fired plants. In the South, natural gas prices arelower than the national average, and natural-gasfiredplants are more economical than in otherregions.Least Expensive Technology OptionsAre Likely Choices for New CapacityFigure 58. Levelized electricity costs for new plants,2015 and <strong>2030</strong> (2004 mills per kilowatthour)755025Incremental transmission costsVariable costs, including fuelFixed costsCapital costs02015<strong>2030</strong>Coal GascombinedcycleWind Nuclear Coal GascombinedcycleWind NuclearTechnology choices for new generating capacity aremade <strong>to</strong> minimize cost while meeting local and Federalemissions constraints. The choice of technologyfor capacity additions is based on the least expensiveoption available (Figure 58) [88]. The reference caseassumes a capital recovery period of 20 years. In addition,the cost of capital is based on competitive marketrates, <strong>to</strong> account for the risks of siting new units.Capital costs decline over time (Table 16), at ratesthat depend on the current stage of development foreach technology. For the newest technologies, capitalcosts are initially adjusted upward <strong>to</strong> reflect the optimisminherent in early estimates of project costs. Asproject developers gain experience, the costs areassumed <strong>to</strong> decline. The decline continues at a progressivelyslower rate as more units are built. Theefficiency of new plants is also assumed <strong>to</strong> improvethrough 2015, <strong>with</strong> heat rates for advanced combinedcycle and coal gasification units declining <strong>to</strong> 6,333 and7,200 Btu per kilowatthour, respectively.Table 16. Costs of producing electricityfrom new plants, 2015 and <strong>2030</strong>Advancedcoal2015 <strong>2030</strong>AdvancedcombinedcycleAdvancedcoalAdvancedcombinedcycleCosts2004 mills per kilowatthourCapital 30.34 11.33 27.78 10.76Fixed 4.73 1.40 4.73 1.40Variable 14.58 36.97 15.82 40.18Incrementaltransmission 3.47 2.88 3.40 2.94Total 53.12 52.58 51.73 55.2878 <strong>Energy</strong> Information Administration / <strong>Annual</strong> <strong>Energy</strong> <strong>Outlook</strong> <strong>2006</strong>


