

Annual Energy Outlook 2006 with Projections to 2030 - Usinfo.org
Annual Energy Outlook 2006 with Projections to 2030 - Usinfo.org
Annual Energy Outlook 2006 with Projections to 2030 - Usinfo.org

Create successful ePaper yourself
Turn your PDF publications into a flip-book with our unique Google optimized e-Paper software.
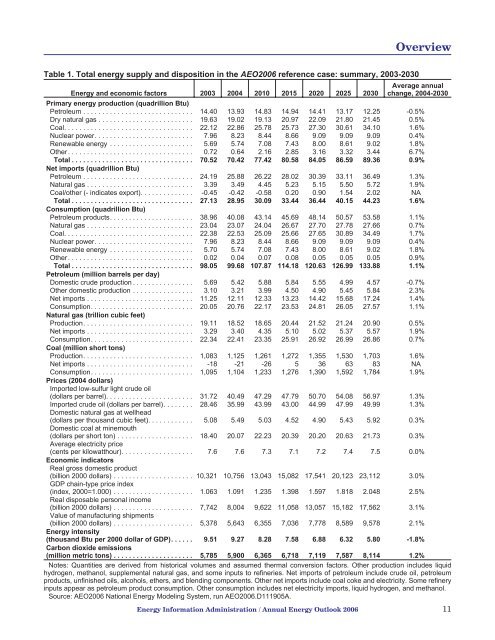
OverviewTable 1. Total energy supply and disposition in the AEO<strong>2006</strong> reference case: summary, 2003-<strong>2030</strong><strong>Energy</strong> and economic fac<strong>to</strong>rs 2003 2004 2010 2015 2020 2025 <strong>2030</strong>Average annualchange, 2004-<strong>2030</strong>Primary energy production (quadrillion Btu)Petroleum ............................. 14.40 13.93 14.83 14.94 14.41 13.17 12.25 -0.5%Dry natural gas ......................... 19.63 19.02 19.13 20.97 22.09 21.80 21.45 0.5%Coal. ................................. 22.12 22.86 25.78 25.73 27.30 30.61 34.10 1.6%Nuclear power. ......................... 7.96 8.23 8.44 8.66 9.09 9.09 9.09 0.4%Renewable energy ...................... 5.69 5.74 7.08 7.43 8.00 8.61 9.02 1.8%Other. ................................ 0.72 0.64 2.16 2.85 3.16 3.32 3.44 6.7%Total ................................ 70.52 70.42 77.42 80.58 84.05 86.59 89.36 0.9%Net imports (quadrillion Btu)Petroleum ............................. 24.19 25.88 26.22 28.02 30.39 33.11 36.49 1.3%Natural gas ............................ 3.39 3.49 4.45 5.23 5.15 5.50 5.72 1.9%Coal/other (- indicates export). ............. -0.45 -0.42 -0.58 0.20 0.90 1.54 2.02 NATotal ................................ 27.13 28.95 30.09 33.44 36.44 40.15 44.23 1.6%Consumption (quadrillion Btu)Petroleum products. ..................... 38.96 40.08 43.14 45.69 48.14 50.57 53.58 1.1%Natural gas ............................ 23.04 23.07 24.04 26.67 27.70 27.78 27.66 0.7%Coal. ................................. 22.38 22.53 25.09 25.66 27.65 30.89 34.49 1.7%Nuclear power. ......................... 7.96 8.23 8.44 8.66 9.09 9.09 9.09 0.4%Renewable energy ...................... 5.70 5.74 7.08 7.43 8.00 8.61 9.02 1.8%Other. ................................ 0.02 0.04 0.07 0.08 0.05 0.05 0.05 0.9%Total ................................ 98.05 99.68 107.87 114.18 120.63 126.99 133.88 1.1%Petroleum (million barrels per day)Domestic crude production ................ 5.69 5.42 5.88 5.84 5.55 4.99 4.57 -0.7%Other domestic production ................ 3.10 3.21 3.99 4.50 4.90 5.45 5.84 2.3%Net imports ............................ 11.25 12.11 12.33 13.23 14.42 15.68 17.24 1.4%Consumption. .......................... 20.05 20.76 22.17 23.53 24.81 26.05 27.57 1.1%Natural gas (trillion cubic feet)Production. ............................ 19.11 18.52 18.65 20.44 21.52 21.24 20.90 0.5%Net imports ............................ 3.29 3.40 4.35 5.10 5.02 5.37 5.57 1.9%Consumption. .......................... 22.34 22.41 23.35 25.91 26.92 26.99 26.86 0.7%Coal (million short <strong>to</strong>ns)Production. ............................ 1,083 1,125 1,261 1,272 1,355 1,530 1,703 1.6%Net imports ............................ -18 -21 -26 5 36 63 83 NAConsumption. .......................... 1,095 1,104 1,233 1,276 1,390 1,592 1,784 1.9%Prices (2004 dollars)Imported low-sulfur light crude oil(dollars per barrel). ...................... 31.72 40.49 47.29 47.79 50.70 54.08 56.97 1.3%Imported crude oil (dollars per barrel). ....... 28.46 35.99 43.99 43.00 44.99 47.99 49.99 1.3%Domestic natural gas at wellhead(dollars per thousand cubic feet). ........... 5.08 5.49 5.03 4.52 4.90 5.43 5.92 0.3%Domestic coal at minemouth(dollars per short <strong>to</strong>n) .................... 18.40 20.07 22.23 20.39 20.20 20.63 21.73 0.3%Average electricity price(cents per kilowatthour). .................. 7.6 7.6 7.3 7.1 7.2 7.4 7.5 0.0%Economic indica<strong>to</strong>rsReal gross domestic product(billion 2000 dollars) ..................... 10,321 10,756 13,043 15,082 17,541 20,123 23,112 3.0%GDP chain-type price index(index, 2000=1.000) ..................... 1.063 1.091 1.235 1.398 1.597 1.818 2.048 2.5%Real disposable personal income(billion 2000 dollars) ..................... 7,742 8,004 9,622 11,058 13,057 15,182 17,562 3.1%Value of manufacturing shipments(billion 2000 dollars) ..................... 5,378 5,643 6,355 7,036 7,778 8,589 9,578 2.1%<strong>Energy</strong> intensity(thousand Btu per 2000 dollar of GDP). ..... 9.51 9.27 8.28 7.58 6.88 6.32 5.80 -1.8%Carbon dioxide emissions(million metric <strong>to</strong>ns) ..................... 5,785 5,900 6,365 6,718 7,119 7,587 8,114 1.2%Notes: Quantities are derived from his<strong>to</strong>rical volumes and assumed thermal conversion fac<strong>to</strong>rs. Other production includes liquidhydrogen, methanol, supplemental natural gas, and some inputs <strong>to</strong> refineries. Net imports of petroleum include crude oil, petroleumproducts, unfinished oils, alcohols, ethers, and blending components. Other net imports include coal coke and electricity. Some refineryinputs appear as petroleum product consumption. Other consumption includes net electricity imports, liquid hydrogen, and methanol.Source: AEO<strong>2006</strong> National <strong>Energy</strong> Modeling System, run AEO<strong>2006</strong>.D111905A.<strong>Energy</strong> Information Administration / <strong>Annual</strong> <strong>Energy</strong> <strong>Outlook</strong> <strong>2006</strong> 11


