

Annual Energy Outlook 2006 with Projections to 2030 - Usinfo.org
Annual Energy Outlook 2006 with Projections to 2030 - Usinfo.org
Annual Energy Outlook 2006 with Projections to 2030 - Usinfo.org

Create successful ePaper yourself
Turn your PDF publications into a flip-book with our unique Google optimized e-Paper software.
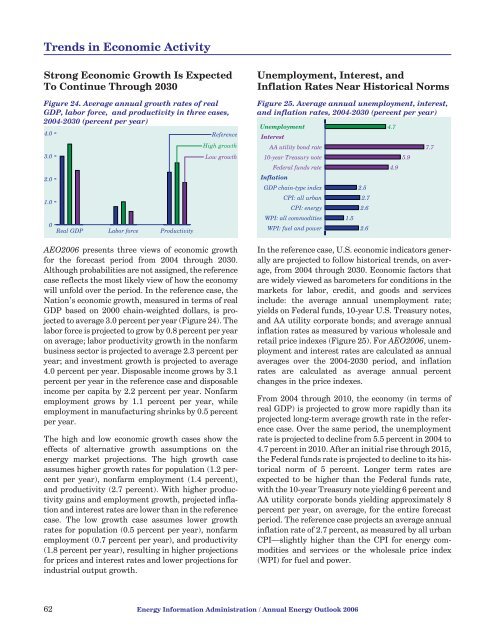
Trends in Economic ActivityStrong Economic Growth Is ExpectedTo Continue Through <strong>2030</strong>Figure 24. Average annual growth rates of realGDP, labor force, and productivity in three cases,2004-<strong>2030</strong> (percent per year)4.0 ReferenceHigh growth3.0Low growth2.01.00.0Real GDP Labor force ProductivityAEO<strong>2006</strong> presents three views of economic growthfor the forecast period from 2004 through <strong>2030</strong>.Although probabilities are not assigned, the referencecase reflects the most likely view of how the economywill unfold over the period. In the reference case, theNation’s economic growth, measured in terms of realGDP based on 2000 chain-weighted dollars, is projected<strong>to</strong> average 3.0 percent per year (Figure 24). Thelabor force is projected <strong>to</strong> grow by 0.8 percent per yearon average; labor productivity growth in the nonfarmbusiness sec<strong>to</strong>r is projected <strong>to</strong> average 2.3 percent peryear; and investment growth is projected <strong>to</strong> average4.0 percent per year. Disposable income grows by 3.1percent per year in the reference case and disposableincome per capita by 2.2 percent per year. Nonfarmemployment grows by 1.1 percent per year, whileemployment in manufacturing shrinks by 0.5 percentper year.The high and low economic growth cases show theeffects of alternative growth assumptions on theenergy market projections. The high growth caseassumes higher growth rates for population (1.2 percentper year), nonfarm employment (1.4 percent),and productivity (2.7 percent). With higher productivitygains and employment growth, projected inflationand interest rates are lower than in the referencecase. The low growth case assumes lower growthrates for population (0.5 percent per year), nonfarmemployment (0.7 percent per year), and productivity(1.8 percent per year), resulting in higher projectionsfor prices and interest rates and lower projections forindustrial output growth.Unemployment, Interest, andInflation Rates Near His<strong>to</strong>rical NormsFigure 25. Average annual unemployment, interest,and inflation rates, 2004-<strong>2030</strong> (percent per year)0.0Unemployment4.7InterestAA utility bond rate7.710-year Treasury note5.9Federal funds rate4.9InflationGDP chain-type index2.5CPI: all urban2.7CPI: energy2.6WPI: all commodities 1.5WPI: fuel and power0.02.6In the reference case, U.S. economic indica<strong>to</strong>rs generallyare projected <strong>to</strong> follow his<strong>to</strong>rical trends, on average,from 2004 through <strong>2030</strong>. Economic fac<strong>to</strong>rs thatare widely viewed as barometers for conditions in themarkets for labor, credit, and goods and servicesinclude: the average annual unemployment rate;yields on Federal funds, 10-year U.S. Treasury notes,and AA utility corporate bonds; and average annualinflation rates as measured by various wholesale andretail price indexes (Figure 25). For AEO<strong>2006</strong>, unemploymentand interest rates are calculated as annualaverages over the 2004-<strong>2030</strong> period, and inflationrates are calculated as average annual percentchanges in the price indexes.From 2004 through 2010, the economy (in terms ofreal GDP) is projected <strong>to</strong> grow more rapidly than itsprojected long-term average growth rate in the referencecase. Over the same period, the unemploymentrate is projected <strong>to</strong> decline from 5.5 percent in 2004 <strong>to</strong>4.7 percent in 2010. After an initial rise through 2015,the Federal funds rate is projected <strong>to</strong> decline <strong>to</strong> its his<strong>to</strong>ricalnorm of 5 percent. Longer term rates areexpected <strong>to</strong> be higher than the Federal funds rate,<strong>with</strong> the 10-year Treasury note yielding 6 percent andAA utility corporate bonds yielding approximately 8percent per year, on average, for the entire forecastperiod. The reference case projects an average annualinflation rate of 2.7 percent, as measured by all urbanCPI—slightly higher than the CPI for energy commoditiesand services or the wholesale price index(WPI) for fuel and power.62 <strong>Energy</strong> Information Administration / <strong>Annual</strong> <strong>Energy</strong> <strong>Outlook</strong> <strong>2006</strong>


