

Annual Energy Outlook 2006 with Projections to 2030 - Usinfo.org
Annual Energy Outlook 2006 with Projections to 2030 - Usinfo.org
Annual Energy Outlook 2006 with Projections to 2030 - Usinfo.org

You also want an ePaper? Increase the reach of your titles
YUMPU automatically turns print PDFs into web optimized ePapers that Google loves.
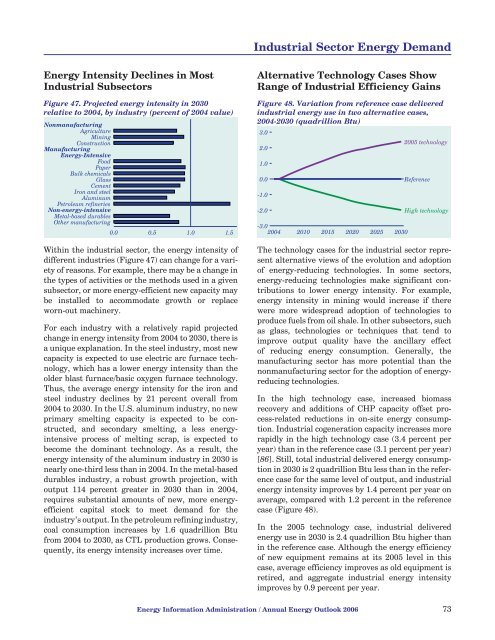
Industrial Sec<strong>to</strong>r <strong>Energy</strong> Demand<strong>Energy</strong> Intensity Declines in MostIndustrial Subsec<strong>to</strong>rsFigure 47. Projected energy intensity in <strong>2030</strong>relative <strong>to</strong> 2004, by industry (percent of 2004 value)NonmanufacturingAgricultureMiningConstructionManufacturing<strong>Energy</strong>-IntensiveFoodPaperBulk chemicalsGlassCementIron and steelAluminumPetroleum refineriesNon-energy-intensiveMetal-based durablesOther manufacturing0.0 0.5 1.0 1.5Within the industrial sec<strong>to</strong>r, the energy intensity ofdifferent industries (Figure 47) can change for a varietyof reasons. For example, there may be a change inthe types of activities or the methods used in a givensubsec<strong>to</strong>r, or more energy-efficient new capacity maybe installed <strong>to</strong> accommodate growth or replaceworn-out machinery.For each industry <strong>with</strong> a relatively rapid projectedchange in energy intensity from 2004 <strong>to</strong> <strong>2030</strong>, there isa unique explanation. In the steel industry, most newcapacity is expected <strong>to</strong> use electric arc furnace technology,which has a lower energy intensity than theolder blast furnace/basic oxygen furnace technology.Thus, the average energy intensity for the iron andsteel industry declines by 21 percent overall from2004 <strong>to</strong> <strong>2030</strong>. In the U.S. aluminum industry, no newprimary smelting capacity is expected <strong>to</strong> be constructed,and secondary smelting, a less energyintensiveprocess of melting scrap, is expected <strong>to</strong>become the dominant technology. As a result, theenergy intensity of the aluminum industry in <strong>2030</strong> isnearly one-third less than in 2004. In the metal-baseddurables industry, a robust growth projection, <strong>with</strong>output 114 percent greater in <strong>2030</strong> than in 2004,requires substantial amounts of new, more energyefficientcapital s<strong>to</strong>ck <strong>to</strong> meet demand for theindustry’s output. In the petroleum refining industry,coal consumption increases by 1.6 quadrillion Btufrom 2004 <strong>to</strong> <strong>2030</strong>, as CTL production grows. Consequently,its energy intensity increases over time.Alternative Technology Cases ShowRange of Industrial Efficiency GainsFigure 48. Variation from reference case deliveredindustrial energy use in two alternative cases,2004-<strong>2030</strong> (quadrillion Btu)3.02.01.00.0-1.0-2.0-3.02004 2010 2015 2020 2025 <strong>2030</strong>2005 technologyReferenceHigh technologyThe technology cases for the industrial sec<strong>to</strong>r representalternative views of the evolution and adoptionof energy-reducing technologies. In some sec<strong>to</strong>rs,energy-reducing technologies make significant contributions<strong>to</strong> lower energy intensity. For example,energy intensity in mining would increase if therewere more widespread adoption of technologies <strong>to</strong>produce fuels from oil shale. In other subsec<strong>to</strong>rs, suchas glass, technologies or techniques that tend <strong>to</strong>improve output quality have the ancillary effec<strong>to</strong>f reducing energy consumption. Generally, themanufacturing sec<strong>to</strong>r has more potential than thenonmanufacturing sec<strong>to</strong>r for the adoption of energyreducingtechnologies.In the high technology case, increased biomassrecovery and additions of CHP capacity offset process-relatedreductions in on-site energy consumption.Industrial cogeneration capacity increases morerapidly in the high technology case (3.4 percent peryear) than in the reference case (3.1 percent per year)[86]. Still, <strong>to</strong>tal industrial delivered energy consumptionin <strong>2030</strong> is 2 quadrillion Btu less than in the referencecase for the same level of output, and industrialenergy intensity improves by 1.4 percent per year onaverage, compared <strong>with</strong> 1.2 percent in the referencecase (Figure 48).In the 2005 technology case, industrial deliveredenergy use in <strong>2030</strong> is 2.4 quadrillion Btu higher thanin the reference case. Although the energy efficiencyof new equipment remains at its 2005 level in thiscase, average efficiency improves as old equipment isretired, and aggregate industrial energy intensityimproves by 0.9 percent per year.<strong>Energy</strong> Information Administration / <strong>Annual</strong> <strong>Energy</strong> <strong>Outlook</strong> <strong>2006</strong> 73


