

Annual Energy Outlook 2006 with Projections to 2030 - Usinfo.org
Annual Energy Outlook 2006 with Projections to 2030 - Usinfo.org
Annual Energy Outlook 2006 with Projections to 2030 - Usinfo.org

You also want an ePaper? Increase the reach of your titles
YUMPU automatically turns print PDFs into web optimized ePapers that Google loves.
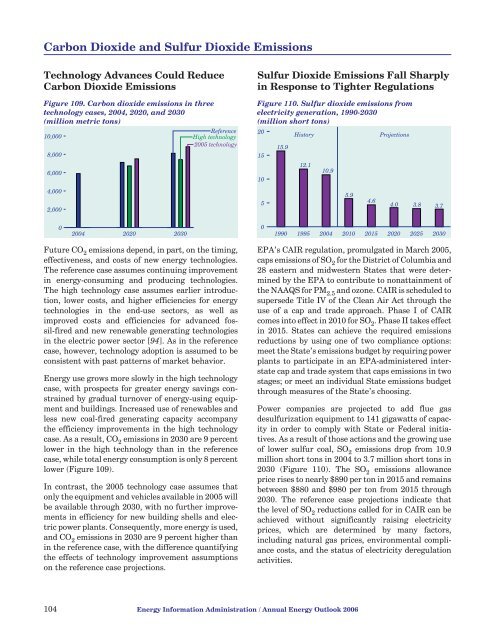
Carbon Dioxide and Sulfur Dioxide EmissionsTechnology Advances Could ReduceCarbon Dioxide EmissionsFigure 109. Carbon dioxide emissions in threetechnology cases, 2004, 2020, and <strong>2030</strong>(million metric <strong>to</strong>ns)10,0008,0006,000ReferenceHigh technology2005 technologySulfur Dioxide Emissions Fall Sharplyin Response <strong>to</strong> Tighter RegulationsFigure 110. Sulfur dioxide emissions fromelectricity generation, 1990-<strong>2030</strong>(million short <strong>to</strong>ns)20151015.9His<strong>to</strong>ry12.110.9<strong>Projections</strong>4,0002,00055.94.64.0 3.83.702004 2020 <strong>2030</strong>01990 1995 2004 2010 2015 2020 2025 <strong>2030</strong>Future CO 2 emissions depend, in part, on the timing,effectiveness, and costs of new energy technologies.The reference case assumes continuing improvementin energy-consuming and producing technologies.The high technology case assumes earlier introduction,lower costs, and higher efficiencies for energytechnologies in the end-use sec<strong>to</strong>rs, as well asimproved costs and efficiencies for advanced fossil-firedand new renewable generating technologiesin the electric power sec<strong>to</strong>r [94]. As in the referencecase, however, technology adoption is assumed <strong>to</strong> beconsistent <strong>with</strong> past patterns of market behavior.<strong>Energy</strong> use grows more slowly in the high technologycase, <strong>with</strong> prospects for greater energy savings constrainedby gradual turnover of energy-using equipmentand buildings. Increased use of renewables andless new coal-fired generating capacity accompanythe efficiency improvements in the high technologycase. As a result, CO 2 emissions in <strong>2030</strong> are 9 percentlower in the high technology than in the referencecase, while <strong>to</strong>tal energy consumption is only 8 percentlower (Figure 109).In contrast, the 2005 technology case assumes tha<strong>to</strong>nly the equipment and vehicles available in 2005 willbe available through <strong>2030</strong>, <strong>with</strong> no further improvementsin efficiency for new building shells and electricpower plants. Consequently, more energy is used,and CO 2 emissions in <strong>2030</strong> are 9 percent higher thanin the reference case, <strong>with</strong> the difference quantifyingthe effects of technology improvement assumptionson the reference case projections.EPA’s CAIR regulation, promulgated in March 2005,caps emissions of SO 2 for the District of Columbia and28 eastern and midwestern States that were determinedby the EPA <strong>to</strong> contribute <strong>to</strong> nonattainment ofthe NAAQS for PM 2.5 and ozone. CAIR is scheduled <strong>to</strong>supersede Title IV of the Clean Air Act through theuse of a cap and trade approach. Phase I of CAIRcomes in<strong>to</strong> effect in 2010 for SO 2. Phase II takes effectin 2015. States can achieve the required emissionsreductions by using one of two compliance options:meet the State’s emissions budget by requiring powerplants <strong>to</strong> participate in an EPA-administered interstatecap and trade system that caps emissions in twostages; or meet an individual State emissions budgetthrough measures of the State’s choosing.Power companies are projected <strong>to</strong> add flue gasdesulfurization equipment <strong>to</strong> 141 gigawatts of capacityin order <strong>to</strong> comply <strong>with</strong> State or Federal initiatives.As a result of those actions and the growing useof lower sulfur coal, SO 2 emissions drop from 10.9million short <strong>to</strong>ns in 2004 <strong>to</strong> 3.7 million short <strong>to</strong>ns in<strong>2030</strong> (Figure 110). The SO 2 emissions allowanceprice rises <strong>to</strong> nearly $890 per <strong>to</strong>n in 2015 and remainsbetween $880 and $980 per <strong>to</strong>n from 2015 through<strong>2030</strong>. The reference case projections indicate thatthe level of SO 2 reductions called for in CAIR can beachieved <strong>with</strong>out significantly raising electricityprices, which are determined by many fac<strong>to</strong>rs,including natural gas prices, environmental compliancecosts, and the status of electricity deregulationactivities.104 <strong>Energy</strong> Information Administration / <strong>Annual</strong> <strong>Energy</strong> <strong>Outlook</strong> <strong>2006</strong>


