Issues in Focusammonia plants, and most are relatively mature;however, the suite of integrated GTL technologieshas not been used on a commercial scale. One loominguncertainty <strong>with</strong> regard <strong>to</strong> GTL is whether a provenpilot plant can be scaled up <strong>to</strong> the size of a commercialplant while reducing capital and operating costs. Akey engineering goal is <strong>to</strong> improve the thermal efficiencyof the GTL process, which is more complexthan either LNG liquefaction or petroleum refining.The leading GTL processes include those developedby Shell, Sasol, Exxon, Rentech, and Syntroleum. Atthis time, there is no indication as <strong>to</strong> which technologywill prevail. Currently, the proponents of thesevarious processes have nearly 800,000 barrels per dayof first generation capacity under development inQatar.AEO<strong>2006</strong> projects domestic GTL production originatingin Alaska, reflecting a longstanding proposal <strong>to</strong>monetize stranded natural gas on the North Slope.GTL liquids would be transported <strong>to</strong> the lower 48refining system. In <strong>2030</strong>, domestic GTL production<strong>to</strong>tals 200,000 barrels per day in the high price case,even though it competes directly <strong>with</strong> the Alaska naturalgas pipeline project. In AEO<strong>2006</strong>, both investmentsare feasible simultaneously. What will actuallyoccur depends on how and where Alaska natural gasstakeholders ultimately decide <strong>to</strong> make their investments.GTL production worldwide exceeds 1.1 millionbarrels per day in the reference case and 2.6million barrels per day in the high price case in <strong>2030</strong>.Biomass-<strong>to</strong>-Liquids. BTL encompasses the productionof fuels from waste wood and other non-foodplant sources, in contrast <strong>to</strong> conventional biodieselproduction, which is based primarily on food-relatedcrops. Because BTL does not ordinarily usefood-related crops, it does not conflict <strong>with</strong> increasingfood demands, although crops grown for BTLfeeds<strong>to</strong>cks would compete <strong>with</strong> food crops for land.BTL gasification technology is based on the CTL process.The resulting syngas is similar, but the distributionof the hydrocarbon components differs. BTL useslower temperatures and pressures than CTL. LikeGTL, the BTL reaction is exothermic and requires acatalyst [67]. There are at least 13 known processescovering directly and indirectly heated gasifiers forthis step.BTL originates from renewable sources, includingwood waste, straw, grain waste, crop waste, garbage,and sewage/sludge. According <strong>to</strong> a leading processdeveloper, 5 <strong>to</strong>ns of biomass yields 1 <strong>to</strong>n of BTL [68].One hectare (2.471 acres) of land generates 4 <strong>to</strong>ns ofBTL. A modestly sized BTL plant under sustainedoperation would require the biomass of slightly morethan 12,000 acres [69]. Unlike biodiesel or ethanol,BTL uses the entire plant and, thereby, requires lessland use.BTL fuels are several times more expensive <strong>to</strong> producethan gasoline or diesel. Without taxes and distributionexpenses, a leading European developerestimates BTL production costs approaching $3.35per gallon by 2007 and falling <strong>to</strong> $2.43 per gallon by2020 [70]. This equates <strong>to</strong> a crude oil equivalent pricein the high $80 per barrel range at current capital costlevels.BTL technology is at the pilot-plant stage of development.The capital cost of a commercial-scale BTLplant could approach $140,000 (2004 dollars) per barrelof capacity, according <strong>to</strong> a study conducted forDOE by Bechtel in 1998 [71]. The estimated initialinvestment level is comparable <strong>with</strong> those for earlyCTL and GTL plants, which have since declined by 50percent or more. Technological innovations over timeand economies of scale could further reduce BTLcosts. The first commercial-scale BTL plant, <strong>with</strong> acapacity just over 4,000 barrels per day. is planned <strong>to</strong>begin operation in Germany after 2008, followed byfour additional facilities. About two-thirds of a BTLplant’s capital cost is related <strong>to</strong> biomass handling andgasification. BTL front-end technology is new andevolving and has parallels <strong>with</strong> cellulose ethanoltechnology.Large BTL plants require huge catchment (staging)areas and incur high transportation costs <strong>to</strong> movefeeds<strong>to</strong>cks <strong>to</strong> a central plant. From a process standpoint,the main challenge for BTL is the high cost ofremoving oxygen. It is unclear whether gasificationand other processing steps can achieve the cost reductionsnecessary <strong>to</strong> make it more competitive. Catalystcosts are high, as they are for other Fischer-Tropschprocesses. Without additional technological advances<strong>to</strong> lower costs, BTL could be limited <strong>to</strong> the productionof fuel extenders rather than primary fuels.Renewable BiofuelsNot <strong>to</strong> be confused <strong>with</strong> BTLs are the renewablebiofuels, ethanol and biodiesel. These fuels can beblended <strong>with</strong> conventional fuels, which enhancestheir commercial attractiveness. Biofuels have highproduction costs and are about 2 <strong>to</strong> 3 times moreexpensive than conventional fuels. Renewable biofueltechnology is relatively mature for corn-based ethanolproduction, and future innovations are notexpected <strong>to</strong> bring its costs down substantially. Future56 <strong>Energy</strong> Information Administration / <strong>Annual</strong> <strong>Energy</strong> <strong>Outlook</strong> <strong>2006</strong>
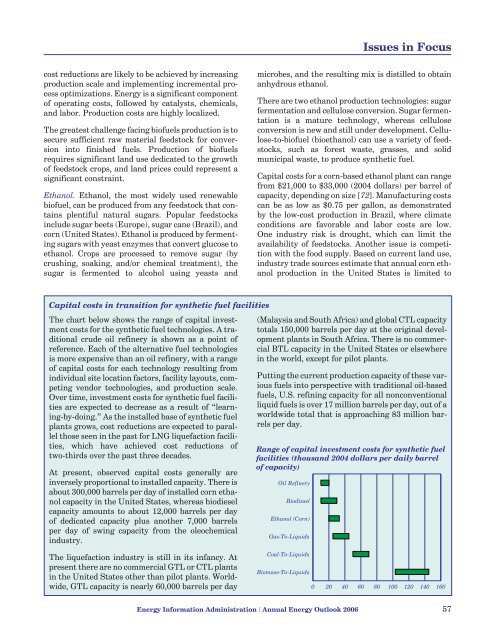
Issues in Focuscost reductions are likely <strong>to</strong> be achieved by increasingproduction scale and implementing incremental processoptimizations. <strong>Energy</strong> is a significant componen<strong>to</strong>f operating costs, followed by catalysts, chemicals,and labor. Production costs are highly localized.The greatest challenge facing biofuels production is <strong>to</strong>secure sufficient raw material feeds<strong>to</strong>ck for conversionin<strong>to</strong> finished fuels. Production of biofuelsrequires significant land use dedicated <strong>to</strong> the growthof feeds<strong>to</strong>ck crops, and land prices could represent asignificant constraint.Ethanol. Ethanol, the most widely used renewablebiofuel, can be produced from any feeds<strong>to</strong>ck that containsplentiful natural sugars. Popular feeds<strong>to</strong>cksinclude sugar beets (Europe), sugar cane (Brazil), andcorn (United States). Ethanol is produced by fermentingsugars <strong>with</strong> yeast enzymes that convert glucose <strong>to</strong>ethanol. Crops are processed <strong>to</strong> remove sugar (bycrushing, soaking, and/or chemical treatment), thesugar is fermented <strong>to</strong> alcohol using yeasts andmicrobes, and the resulting mix is distilled <strong>to</strong> obtainanhydrous ethanol.There are two ethanol production technologies: sugarfermentation and cellulose conversion. Sugar fermentationis a mature technology, whereas celluloseconversion is new and still under development. Cellulose-<strong>to</strong>-biofuel(bioethanol) can use a variety of feeds<strong>to</strong>cks,such as forest waste, grasses, and solidmunicipal waste, <strong>to</strong> produce synthetic fuel.Capital costs for a corn-based ethanol plant can rangefrom $21,000 <strong>to</strong> $33,000 (2004 dollars) per barrel ofcapacity, depending on size [72]. Manufacturing costscan be as low as $0.75 per gallon, as demonstratedby the low-cost production in Brazil, where climateconditions are favorable and labor costs are low.One industry risk is drought, which can limit theavailability of feeds<strong>to</strong>cks. Another issue is competition<strong>with</strong> the food supply. Based on current land use,industry trade sources estimate that annual corn ethanolproduction in the United States is limited <strong>to</strong>Capital costs in transition for synthetic fuel facilitiesThe chart below shows the range of capital investmentcosts for the synthetic fuel technologies. A traditionalcrude oil refinery is shown as a point ofreference. Each of the alternative fuel technologiesis more expensive than an oil refinery, <strong>with</strong> a rangeof capital costs for each technology resulting fromindividual site location fac<strong>to</strong>rs, facility layouts, competingvendor technologies, and production scale.Over time, investment costs for synthetic fuel facilitiesare expected <strong>to</strong> decrease as a result of “learning-by-doing.”As the installed base of synthetic fuelplants grows, cost reductions are expected <strong>to</strong> parallelthose seen in the past for LNG liquefaction facilities,which have achieved cost reductions oftwo-thirds over the past three decades.At present, observed capital costs generally areinversely proportional <strong>to</strong> installed capacity. There isabout 300,000 barrels per day of installed corn ethanolcapacity in the United States, whereas biodieselcapacity amounts <strong>to</strong> about 12,000 barrels per dayof dedicated capacity plus another 7,000 barrelsper day of swing capacity from the oleochemicalindustry.(Malaysia and South Africa) and global CTL capacity<strong>to</strong>tals 150,000 barrels per day at the original developmentplants in South Africa. There is no commercialBTL capacity in the United States or elsewherein the world, except for pilot plants.Putting the current production capacity of these variousfuels in<strong>to</strong> perspective <strong>with</strong> traditional oil-basedfuels, U.S. refining capacity for all nonconventionalliquid fuels is over 17 million barrels per day, out of aworldwide <strong>to</strong>tal that is approaching 83 million barrelsper day.Range of capital investment costs for synthetic fuelfacilities (thousand 2004 dollars per daily barrelof capacity)Oil RefineryBiodieselEthanol (Corn)Gas-To-LiquidsThe liquefaction industry is still in its infancy. Atpresent there are no commercial GTL or CTL plantsin the United States other than pilot plants. Worldwide,GTL capacity is nearly 60,000 barrels per dayCoal-To-LiquidsBiomass-To-Liquids0 20 40 60 80 100 120 140 160<strong>Energy</strong> Information Administration / <strong>Annual</strong> <strong>Energy</strong> <strong>Outlook</strong> <strong>2006</strong> 57