Annual Energy Outlook 2006 with Projections to 2030 - Usinfo.org
Annual Energy Outlook 2006 with Projections to 2030 - Usinfo.org
Annual Energy Outlook 2006 with Projections to 2030 - Usinfo.org
You also want an ePaper? Increase the reach of your titles
YUMPU automatically turns print PDFs into web optimized ePapers that Google loves.
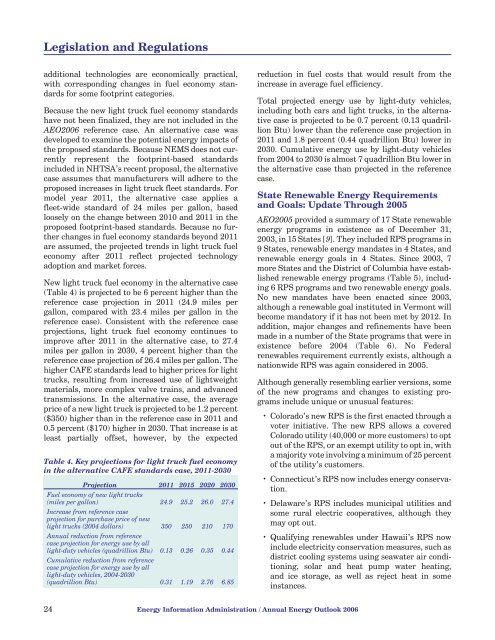
Legislation and Regulationsadditional technologies are economically practical,<strong>with</strong> corresponding changes in fuel economy standardsfor some footprint categories.Because the new light truck fuel economy standardshave not been finalized, they are not included in theAEO<strong>2006</strong> reference case. An alternative case wasdeveloped <strong>to</strong> examine the potential energy impacts ofthe proposed standards. Because NEMS does not currentlyrepresent the footprint-based standardsincluded in NHTSA’s recent proposal, the alternativecase assumes that manufacturers will adhere <strong>to</strong> theproposed increases in light truck fleet standards. Formodel year 2011, the alternative case applies afleet-wide standard of 24 miles per gallon, basedloosely on the change between 2010 and 2011 in theproposed footprint-based standards. Because no furtherchanges in fuel economy standards beyond 2011are assumed, the projected trends in light truck fueleconomy after 2011 reflect projected technologyadoption and market forces.New light truck fuel economy in the alternative case(Table 4) is projected <strong>to</strong> be 6 percent higher than thereference case projection in 2011 (24.9 miles pergallon, compared <strong>with</strong> 23.4 miles per gallon in thereference case). Consistent <strong>with</strong> the reference caseprojections, light truck fuel economy continues <strong>to</strong>improve after 2011 in the alternative case, <strong>to</strong> 27.4miles per gallon in <strong>2030</strong>, 4 percent higher than thereference case projection of 26.4 miles per gallon. Thehigher CAFE standards lead <strong>to</strong> higher prices for lighttrucks, resulting from increased use of lightweightmaterials, more complex valve trains, and advancedtransmissions. In the alternative case, the averageprice of a new light truck is projected <strong>to</strong> be 1.2 percent($350) higher than in the reference case in 2011 and0.5 percent ($170) higher in <strong>2030</strong>. That increase is atleast partially offset, however, by the expectedTable 4. Key projections for light truck fuel economyin the alternative CAFE standards case, 2011-<strong>2030</strong>Projection 2011 2015 2020 <strong>2030</strong>Fuel economy of new light trucks(miles per gallon) 24.9 25.2 26.0 27.4Increase from reference caseprojection for purchase price of newlight trucks (2004 dollars) 350 250 210 170<strong>Annual</strong> reduction from referencecase projection for energy use by alllight-duty vehicles (quadrillion Btu) 0.13 0.26 0.35 0.44Cumulative reduction from referencecase projection for energy use by alllight-duty vehicles, 2004-<strong>2030</strong>(quadrillion Btu) 0.31 1.19 2.76 6.85reduction in fuel costs that would result from theincrease in average fuel efficiency.Total projected energy use by light-duty vehicles,including both cars and light trucks, in the alternativecase is projected <strong>to</strong> be 0.7 percent (0.13 quadrillionBtu) lower than the reference case projection in2011 and 1.8 percent (0.44 quadrillion Btu) lower in<strong>2030</strong>. Cumulative energy use by light-duty vehiclesfrom 2004 <strong>to</strong> <strong>2030</strong> is almost 7 quadrillion Btu lower inthe alternative case than projected in the referencecase.State Renewable <strong>Energy</strong> Requirementsand Goals: Update Through 2005AEO2005 provided a summary of 17 State renewableenergy programs in existence as of December 31,2003, in 15 States [9]. They included RPS programs in9 States, renewable energy mandates in 4 States, andrenewable energy goals in 4 States. Since 2003, 7more States and the District of Columbia have establishedrenewable energy programs (Table 5), including6 RPS programs and two renewable energy goals.No new mandates have been enacted since 2003,although a renewable goal instituted in Vermont willbecome manda<strong>to</strong>ry if it has not been met by 2012. Inaddition, major changes and refinements have beenmade in a number of the State programs that were inexistence before 2004 (Table 6). No Federalrenewables requirement currently exists, although anationwide RPS was again considered in 2005.Although generally resembling earlier versions, someof the new programs and changes <strong>to</strong> existing programsinclude unique or unusual features:• Colorado’s new RPS is the first enacted through avoter initiative. The new RPS allows a coveredColorado utility (40,000 or more cus<strong>to</strong>mers) <strong>to</strong> op<strong>to</strong>ut of the RPS, or an exempt utility <strong>to</strong> opt in, <strong>with</strong>a majority vote involving a minimum of 25 percen<strong>to</strong>f the utility’s cus<strong>to</strong>mers.• Connecticut’s RPS now includes energy conservation.• Delaware’s RPS includes municipal utilities andsome rural electric cooperatives, although theymay opt out.• Qualifying renewables under Hawaii’s RPS nowinclude electricity conservation measures, such asdistrict cooling systems using seawater air conditioning,solar and heat pump water heating,and ice s<strong>to</strong>rage, as well as reject heat in someinstances.24 <strong>Energy</strong> Information Administration / <strong>Annual</strong> <strong>Energy</strong> <strong>Outlook</strong> <strong>2006</strong>


