

Annual Energy Outlook 2006 with Projections to 2030 - Usinfo.org
Annual Energy Outlook 2006 with Projections to 2030 - Usinfo.org
Annual Energy Outlook 2006 with Projections to 2030 - Usinfo.org

You also want an ePaper? Increase the reach of your titles
YUMPU automatically turns print PDFs into web optimized ePapers that Google loves.
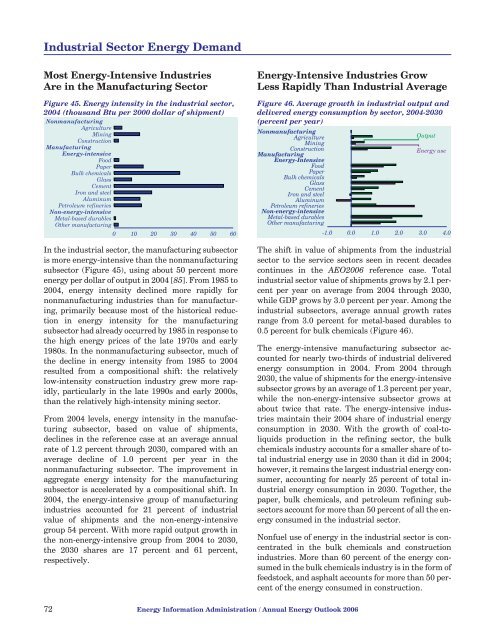
Industrial Sec<strong>to</strong>r <strong>Energy</strong> DemandMost <strong>Energy</strong>-Intensive IndustriesAre in the Manufacturing Sec<strong>to</strong>rFigure 45. <strong>Energy</strong> intensity in the industrial sec<strong>to</strong>r,2004 (thousand Btu per 2000 dollar of shipment)NonmanufacturingAgricultureMiningConstructionManufacturing<strong>Energy</strong>-intensiveFoodPaperBulk chemicalsGlassCementIron and steelAluminumPetroleum refineriesNon-energy-intensiveMetal-based durablesOther manufacturing0 10 20 30 40 50 60In the industrial sec<strong>to</strong>r, the manufacturing subsec<strong>to</strong>ris more energy-intensive than the nonmanufacturingsubsec<strong>to</strong>r (Figure 45), using about 50 percent moreenergy per dollar of output in 2004 [85]. From 1985 <strong>to</strong>2004, energy intensity declined more rapidly fornonmanufacturing industries than for manufacturing,primarily because most of the his<strong>to</strong>rical reductionin energy intensity for the manufacturingsubsec<strong>to</strong>r had already occurred by 1985 in response <strong>to</strong>the high energy prices of the late 1970s and early1980s. In the nonmanufacturing subsec<strong>to</strong>r, much ofthe decline in energy intensity from 1985 <strong>to</strong> 2004resulted from a compositional shift: the relativelylow-intensity construction industry grew more rapidly,particularly in the late 1990s and early 2000s,than the relatively high-intensity mining sec<strong>to</strong>r.From 2004 levels, energy intensity in the manufacturingsubsec<strong>to</strong>r, based on value of shipments,declines in the reference case at an average annualrate of 1.2 percent through <strong>2030</strong>, compared <strong>with</strong> anaverage decline of 1.0 percent per year in thenonmanufacturing subsec<strong>to</strong>r. The improvement inaggregate energy intensity for the manufacturingsubsec<strong>to</strong>r is accelerated by a compositional shift. In2004, the energy-intensive group of manufacturingindustries accounted for 21 percent of industrialvalue of shipments and the non-energy-intensivegroup 54 percent. With more rapid output growth inthe non-energy-intensive group from 2004 <strong>to</strong> <strong>2030</strong>,the <strong>2030</strong> shares are 17 percent and 61 percent,respectively.<strong>Energy</strong>-Intensive Industries GrowLess Rapidly Than Industrial AverageFigure 46. Average growth in industrial output anddelivered energy consumption by sec<strong>to</strong>r, 2004-<strong>2030</strong>(percent per year)NonmanufacturingAgricultureOutputMiningConstructionManufacturing<strong>Energy</strong> use<strong>Energy</strong>-IntensiveFoodPaperBulk chemicalsGlassCementIron and steelAluminumPetroleum refineriesNon-energy-intensiveMetal-based durablesOther manufacturing-1.0 0.0 1.0 2.0 3.0 4.0The shift in value of shipments from the industrialsec<strong>to</strong>r <strong>to</strong> the service sec<strong>to</strong>rs seen in recent decadescontinues in the AEO<strong>2006</strong> reference case. Totalindustrial sec<strong>to</strong>r value of shipments grows by 2.1 percentper year on average from 2004 through <strong>2030</strong>,while GDP grows by 3.0 percent per year. Among theindustrial subsec<strong>to</strong>rs, average annual growth ratesrange from 3.0 percent for metal-based durables <strong>to</strong>0.5 percent for bulk chemicals (Figure 46).The energy-intensive manufacturing subsec<strong>to</strong>r accountedfor nearly two-thirds of industrial deliveredenergy consumption in 2004. From 2004 through<strong>2030</strong>, the value of shipments for the energy-intensivesubsec<strong>to</strong>r grows by an average of 1.3 percent per year,while the non-energy-intensive subsec<strong>to</strong>r grows atabout twice that rate. The energy-intensive industriesmaintain their 2004 share of industrial energyconsumption in <strong>2030</strong>. With the growth of coal-<strong>to</strong>liquidsproduction in the refining sec<strong>to</strong>r, the bulkchemicals industry accounts for a smaller share of <strong>to</strong>talindustrial energy use in <strong>2030</strong> than it did in 2004;however, it remains the largest industrial energy consumer,accounting for nearly 25 percent of <strong>to</strong>tal industrialenergy consumption in <strong>2030</strong>. Together, thepaper, bulk chemicals, and petroleum refining subsec<strong>to</strong>rsaccount for more than 50 percent of all the energyconsumed in the industrial sec<strong>to</strong>r.Nonfuel use of energy in the industrial sec<strong>to</strong>r is concentratedin the bulk chemicals and constructionindustries. More than 60 percent of the energy consumedin the bulk chemicals industry is in the form offeeds<strong>to</strong>ck, and asphalt accounts for more than 50 percen<strong>to</strong>f the energy consumed in construction.72 <strong>Energy</strong> Information Administration / <strong>Annual</strong> <strong>Energy</strong> <strong>Outlook</strong> <strong>2006</strong>


