Agosto de 2004
Agosto de 2004
Agosto de 2004

Create successful ePaper yourself
Turn your PDF publications into a flip-book with our unique Google optimized e-Paper software.
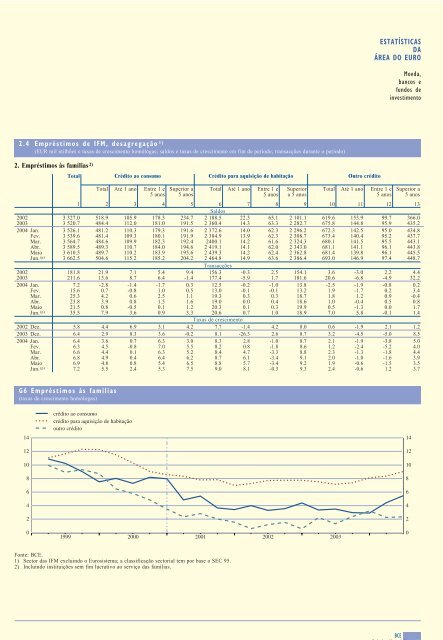
ESTATÍSTICASDAÁREA DO EUROMoeda,bancos efundos <strong>de</strong>investimento2.4 Empréstimos <strong>de</strong> IFM, <strong>de</strong>sagregação 1)(EUR mil milhões e taxas <strong>de</strong> crescimento homólogas; saldos e taxas <strong>de</strong> crescimento em fim <strong>de</strong> período, transacções durante o período)2. Empréstimos às famílias 2)TotalCrédito ao consumo Crédito para aquisição <strong>de</strong> habitação Outro crédito20022003<strong>2004</strong> Jan.Fev.Mar.Abr.MaioJun. (p)20022003<strong>2004</strong> Jan.Fev.Mar.Abr.MaioJun. (p)2002 Dez.2003 Dez.<strong>2004</strong> Jan.Fev.Mar.Abr.MaioJun. (p)Total Até 1 ano Entre 1 e5 anosSuperior a5 anosTotal Até 1 ano Entre 1 e5 anosSuperiora 5 anosTotal Até 1 ano Entre 1 e5 anosSuperior a5 anos1 2 3 4 5 6 7 8 9 10 11 12 13Saldos3 327.0 518.9 105.9 178.3 234.7 2 188.5 22.3 65.1 2 101.1 619.6 153.9 99.7 366.03 520.7 484.4 112.0 181.0 191.5 2 360.4 14.3 63.3 2 282.7 675.8 144.8 95.9 435.23 526.1 481.2 110.3 179.3 191.6 2 372.6 14.0 62.3 2 296.2 672.3 142.5 95.0 434.83 539.6 481.4 109.3 180.1 191.9 2 384.9 13.9 62.3 2 308.7 673.4 140.4 95.2 437.73 564.7 484.6 109.9 182.3 192.4 2400.1 14.2 61.6 2 324.3 680.1 141.5 95.5 443.13 589.5 489.3 110.7 184.0 194.6 2 419.1 14.1 62.0 2 343.0 681.1 141.1 96.1 443.83 610.5 489.7 110.2 183.9 195.6 2 439.3 14.2 62.4 2 362.8 681.4 139.8 96.1 445.53 662.5 504.6 115.2 185.2 204.2 2 464.8 14.9 63.6 2 386.4 693.0 146.9 97.4 448.7Transacções181.8 21.9 7.1 5.4 9.4 156.3 -0.3 2.5 154.1 3.6 -3.0 2.2 4.4211.6 13.6 8.7 6.4 -1.4 177.4 -5.9 1.7 181.6 20.6 -6.8 -4.9 32.27.2 -2.8 -1.4 -1.7 0.3 12.5 -0.2 -1.0 13.8 -2.5 -1.9 -0.8 0.215.6 0.7 -0.8 1.0 0.5 13.0 -0.1 -0.1 13.2 1.9 -1.7 0.2 3.425.3 4.2 0.6 2.5 1.1 19.3 0.3 0.3 18.7 1.8 1.2 0.9 -0.423.8 3.9 0.8 1.5 1.6 19.0 0.0 0.4 18.6 1.0 -0.4 0.5 0.821.5 0.8 -0.5 0.1 1.2 20.3 0.1 0.3 19.9 0.5 -1.3 0.0 1.735.5 7.9 3.6 0.9 3.3 20.6 0.7 1.0 18.9 7.0 5.8 -0.1 1.4Taxas <strong>de</strong> crescimento5.8 4.4 6.9 3.1 4.2 7.7 -1.4 4.2 8.0 0.6 -1.9 2.1 1.26.4 2.9 8.3 3.6 -0.2 8.1 -26.3 2.6 8.7 3.2 -4.5 -5.0 8.56.4 3.6 0.7 6.3 3.0 8.3 2.8 -1.0 8.7 2.1 -1.9 -3.8 5.06.3 4.5 -0.8 7.0 5.5 8.2 0.8 -1.8 8.6 1.2 -2.4 -5.2 4.06.6 4.4 0.1 6.3 5.2 8.4 4.7 -3.3 8.8 2.3 -1.3 -1.8 4.46.8 4.9 0.4 6.4 6.2 8.7 6.1 -3.4 9.1 2.0 -1.0 -1.6 3.96.9 4.8 0.8 5.4 6.5 8.8 5.7 -3.4 9.2 1.9 -0.6 -1.5 3.57.2 5.5 2.4 5.3 7.5 9.0 8.1 -0.3 9.3 2.4 -0.6 1.2 3.7G6 Empréstimos às famílias(taxas <strong>de</strong> crescimento homólogas)14121086420crédito ao consumocrédito para aquisição <strong>de</strong> habitaçãooutro crédito1999 2000 2001 2002 200314121086420Fonte: BCE.1) Sector das IFM excluindo o Eurosistema; a classificação sectorial tem por base o SEC 95.2) Incluindo instituições sem fim lucrativo ao serviço das famílias.BCEBoletim Mensal<strong>Agosto</strong> <strong>2004</strong>E 15