Agosto de 2004
Agosto de 2004
Agosto de 2004

You also want an ePaper? Increase the reach of your titles
YUMPU automatically turns print PDFs into web optimized ePapers that Google loves.
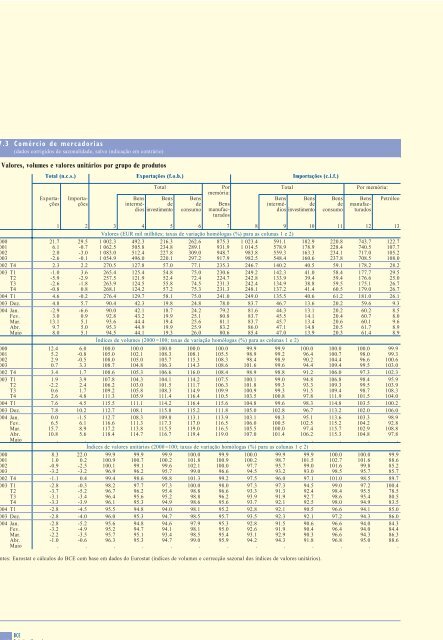
7.3 Comércio <strong>de</strong> mercadorias(dados corrigidos <strong>de</strong> sazonalida<strong>de</strong>, salvo indicação em contrário)1. Valores, volumes e valores unitários por grupo <strong>de</strong> produtosTotal (n.c.s.)Exportações (f.o.b.)Importações (c.i.f.)Pormemória:BensmanufacturadosExportaçõesImportaçõesTotalBens Bensintermédios<strong>de</strong>investimentoBens<strong>de</strong>consumoTotalBens Bensintermédios<strong>de</strong>investimentoBens<strong>de</strong>consumoPor memória:BensmanufacturadosPetróleo20002001200220032002 T42003 T1T2T3T4<strong>2004</strong> T12003 Dez.<strong>2004</strong> Jan.Fev.Mar.Abr.Maio20002001200220032002 T42003 T1T2T3T4<strong>2004</strong> T12003 Dez.<strong>2004</strong> Jan.Fev.Mar.Abr.Maio20002001200220032002 T42003 T1T2T3T4<strong>2004</strong> T12003 Dez.<strong>2004</strong> Jan.Fev.Mar.Abr.Maio1 2 3 4 5 6 7 8 9 10 11 12 13Valores (EUR mil milhões; taxas <strong>de</strong> variação homólogas (%) para as colunas 1 e 2)21.7 29.5 1 002.3 492.3 216.3 262.6 875.3 1 023.4 591.1 182.9 220.8 743.7 122.76.1 -0.7 1 062.5 505.8 234.8 289.1 931.9 1 014.5 578.9 178.9 228.4 740.5 107.72.0 -3.0 1 083.0 512.4 227.8 309.0 948.7 983.8 559.3 163.3 234.1 717.0 105.2-2.6 -0.1 1 054.9 496.0 220.1 297.2 917.9 982.5 548.4 160.6 237.8 708.5 108.02.3 2.2 270.5 127.8 57.0 77.1 235.3 246.7 140.2 40.5 59.1 178.2 28.2-1.0 3.6 265.4 125.4 54.8 75.0 230.6 249.2 142.3 41.0 58.4 177.7 29.5-5.9 -2.9 257.5 121.9 52.4 72.4 224.7 242.8 133.9 39.4 59.4 176.6 25.0-2.6 -1.8 263.9 124.5 55.8 74.5 231.3 242.4 134.9 38.8 59.5 175.1 26.7-0.8 0.8 268.1 124.2 57.2 75.3 231.3 248.1 137.2 41.4 60.5 179.0 26.74.6 -0.2 276.4 129.7 58.1 75.0 241.0 249.0 135.5 40.6 61.2 181.0 26.14.8 5.7 90.4 42.3 19.8 24.8 78.0 83.7 46.7 13.6 20.2 59.6 9.3-2.9 -6.6 90.0 42.1 18.7 24.2 79.2 81.6 44.3 13.1 20.2 60.2 8.53.0 0.9 92.8 43.2 19.9 25.1 80.8 83.7 45.5 14.1 20.4 60.7 8.013.1 5.1 93.6 44.4 19.4 25.6 81.1 83.7 45.7 13.4 20.6 60.1 9.69.7 5.0 95.3 44.9 19.9 25.9 83.2 86.0 47.1 14.8 20.5 61.7 8.98.0 5.1 94.5 44.1 19.3 26.0 80.6 85.4 47.0 13.9 20.3 61.4 8.9Índices <strong>de</strong> volumes (2000 =100; taxas <strong>de</strong> variação homólogas (%) para as colunas 1 e 2)12.4 6.0 100.0 100.0 100.0 100.0 100.0 99.9 99.9 100.0 100.0 100.0 99.95.2 -0.8 105.0 102.1 108.3 108.1 105.5 98.9 99.2 96.4 100.7 98.0 99.32.9 -0.5 108.0 105.0 105.7 115.3 108.3 98.4 98.9 90.2 104.4 96.6 100.60.7 3.3 108.7 104.8 106.3 114.3 108.6 101.6 99.6 94.4 109.4 99.5 103.03.4 1.7 108.6 105.3 106.6 116.0 108.4 98.9 98.8 91.2 106.0 97.3 102.31.9 3.9 107.8 104.3 104.1 114.2 107.5 100.1 99.0 94.8 106.8 98.4 95.9-2.2 2.4 106.2 103.0 101.5 111.7 106.3 101.8 99.3 93.3 109.3 99.5 103.90.6 1.7 109.2 105.8 108.3 114.9 109.9 100.9 99.3 91.5 109.4 98.7 108.32.6 4.8 111.3 105.9 111.4 116.4 110.5 103.5 100.8 97.8 111.9 101.5 104.07.6 4.5 115.5 111.1 114.2 116.4 115.6 104.8 99.6 98.3 114.8 103.5 100.27.8 10.2 112.7 108.1 115.8 115.2 111.8 105.0 102.8 96.7 113.2 102.0 106.00.0 -1.5 112.7 108.3 109.8 113.1 113.9 103.1 98.3 95.1 113.6 103.3 98.96.5 6.1 116.6 111.3 117.3 117.0 116.5 106.0 100.5 102.5 115.2 104.2 92.815.7 8.9 117.2 113.8 115.5 119.0 116.5 105.5 100.0 97.4 115.7 102.9 108.810.8 5.6 118.4 114.7 116.7 119.4 119.0 107.0 101.4 106.2 115.3 104.8 97.8. . . . . . . . . . . . .Índices <strong>de</strong> valores unitários (2000 =100; taxas <strong>de</strong> variação homólogas (%) para as colunas 1 e 2)8.3 22.0 99.9 99.9 99.9 100.0 99.9 100.0 99.9 99.9 100.0 100.0 99.91.0 0.2 100.9 100.7 100.2 101.8 100.9 100.2 98.7 101.5 102.7 101.6 88.6-0.9 -2.5 100.1 99.1 99.6 102.1 100.0 97.7 95.7 99.0 101.6 99.8 85.2-3.2 -3.2 96.9 96.2 95.7 99.0 96.6 94.5 93.2 93.0 98.5 95.7 85.7-1.1 0.4 99.4 98.6 98.8 101.3 99.2 97.5 96.0 97.1 101.0 98.5 89.7-2.8 -0.3 98.2 97.7 97.3 100.0 98.0 97.3 97.3 94.5 99.0 97.2 100.4-3.7 -5.2 96.7 96.2 95.4 98.8 96.6 93.3 91.3 92.4 98.4 95.5 78.5-3.1 -3.4 96.4 95.6 95.2 98.8 96.2 93.9 91.9 92.7 98.6 95.4 80.5-3.3 -3.9 96.1 95.3 94.9 98.6 95.6 93.7 92.1 92.5 98.0 94.9 83.5-2.8 -4.5 95.5 94.8 94.0 98.1 95.2 92.8 92.1 90.5 96.6 94.1 85.0-2.8 -4.0 96.0 95.3 94.7 98.5 95.7 93.5 92.3 92.1 97.2 94.3 86.0-2.8 -5.2 95.6 94.8 94.6 97.9 95.3 92.8 91.5 90.6 96.6 94.0 84.3-3.2 -4.9 95.2 94.7 94.1 98.1 95.0 92.6 91.9 90.4 96.4 94.0 84.4-2.2 -3.5 95.7 95.1 93.4 98.5 95.4 93.1 92.9 90.3 96.6 94.3 86.3-1.0 -0.6 96.3 95.3 94.7 99.0 95.9 94.2 94.3 91.8 96.8 95.0 88.6. . . . . . . . . . . . .Fontes: Eurostat e cálculos do BCE com base em dados do Eurostat (índices <strong>de</strong> volumes e correcção sazonal dos índices <strong>de</strong> valores unitários).BCEBoletim MensalE 62 <strong>Agosto</strong> <strong>2004</strong>