Agosto de 2004
Agosto de 2004
Agosto de 2004

You also want an ePaper? Increase the reach of your titles
YUMPU automatically turns print PDFs into web optimized ePapers that Google loves.
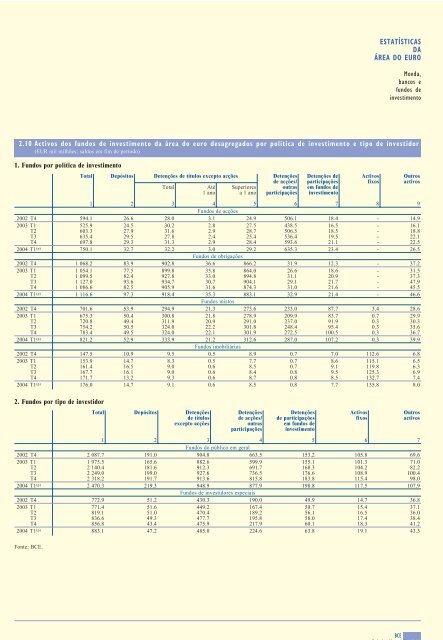
ESTATÍSTICASDAÁREA DO EUROMoeda,bancos efundos <strong>de</strong>investimento2.10 Activos dos fundos <strong>de</strong> investimento da área do euro <strong>de</strong>sagregados por política <strong>de</strong> investimento e tipo <strong>de</strong> investidor(EUR mil milhões; saldos em fim <strong>de</strong> período)1. Fundos por política <strong>de</strong> investimentoFonte: BCE.TotalDepósitosDetenções <strong>de</strong> títulos excepto acçõesTotalAté1 anoSuperioresa 1 anoDetenções<strong>de</strong> acções/outrasparticipaçõesDetenções <strong>de</strong>participaçõesem fundos <strong>de</strong>investimento1 2 3 4 5 6 7 8 9Fundos <strong>de</strong> acções2002 T4594.1 26.6 28.0 3.1 24.9 506.1 18.4 - 14.92003 T1525.9 24.5 30.2 2.8 27.5 438.5 16.5 - 16.1T2603.3 27.9 31.6 2.9 28.7 506.5 18.5 - 18.8T3635.4 29.5 27.8 2.4 25.4 536.4 19.5 - 22.1T4697.8 29.3 31.3 2.9 28.4 593.6 21.1 - 22.5<strong>2004</strong> T1 (p) 750.1 32.7 32.2 3.0 29.2 635.3 23.4 - 26.5Fundos <strong>de</strong> obrigações2002 T41 068.2 83.9 902.8 36.6 866.2 31.9 12.3 - 37.22003 T11 054.1 77.5 899.8 35.8 864.0 26.6 18.6 - 31.5T21 099.5 82.4 927.8 33.0 894.8 31.1 20.9 - 37.3T31 127.0 93.6 934.7 30.7 904.1 29.1 21.7 - 47.9T41 086.6 82.5 905.9 31.6 874.3 31.0 21.6 - 45.5<strong>2004</strong> T1 (p) 1 116.6 97.3 918.4 35.3 883.1 32.9 21.4 - 46.6<strong>2004</strong> T1 (p) 176.0 14.7 9.1 0.6 8.5 0.8 7.7 135.8 8.0Fundos mistos2002 T4701.6 53.9 294.9 21.3 273.6 233.0 87.7 3.4 28.6<strong>2004</strong> T1 (p) 883.1 47.2 485.0 224.6 63.8 19.1 43.32003 T1675.3 50.4 300.8 21.8 278.9 209.9 83.7 0.7 29.9T2720.8 49.4 311.9 20.9 291.0 237.0 91.9 0.3 30.3T3754.2 50.5 324.0 22.2 301.8 248.4 95.4 0.3 35.6T4783.4 49.5 324.0 22.1 301.9 272.5 100.5 0.3 36.7<strong>2004</strong> T1 (p) 821.2 52.9 333.9 21.2 312.6 287.0 107.2 0.3 39.9Fundos imobiliários2002 T4147.5 10.9 9.5 0.5 8.9 0.7 7.0 112.6 6.82003 T1153.9 14.7 8.3 0.5 7.7 0.7 8.6 115.1 6.5T2161.4 16.5 9.0 0.6 8.5 0.7 9.1 119.8 6.3T3167.7 16.1 9.0 0.6 8.4 0.8 9.5 125.3 6.9T4171.7 13.2 9.3 0.6 8.7 0.8 8.5 132.7 7.42. Fundos por tipo <strong>de</strong> investidorTotal Depósitos Detenções<strong>de</strong> títulosDetenções<strong>de</strong> acções/Detenções<strong>de</strong> participaçõesActivosfixosOutrosactivosexcepto acçõesoutrasparticipaçõesem fundos <strong>de</strong>investimento1 2 3 4 5 6 7Fundos do público em geral2002 T42 087.7 191.0 904.8 663.5 153.2 105.8 69.62003 T11 975.5 165.6 882.6 599.9 155.1 101.3 71.0T22 140.4 181.6 912.3 691.7 168.3 104.2 82.2T32 249.0 199.0 927.6 736.5 176.6 108.9 100.4T42 318.2 191.7 913.6 815.8 183.8 115.4 98.0<strong>2004</strong> T1 (p) 2 470.3 219.3 948.9 877.9 198.8 117.5 107.9Fundos <strong>de</strong> investidores especiais2002 T4772.9 51.2 430.3 190.0 49.9 14.7 36.82003 T1771.4 51.6 449.2 167.4 50.7 15.4 37.1T2819.1 51.0 470.4 189.2 56.1 16.5 36.0T3836.6 49.3 477.7 195.8 58.0 17.4 38.4T4856.8 43.4 475.9 217.9 60.1 18.3 41.2ActivosfixosOutrosactivosBCEBoletim Mensal<strong>Agosto</strong> <strong>2004</strong>E25