Agosto de 2004
Agosto de 2004
Agosto de 2004

Create successful ePaper yourself
Turn your PDF publications into a flip-book with our unique Google optimized e-Paper software.
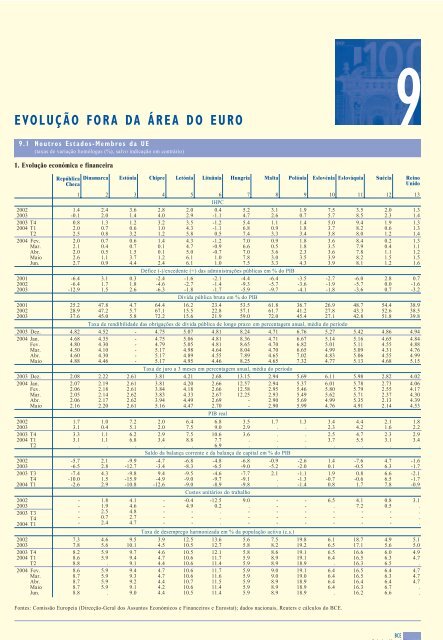
EVOLUÇÃO FORA DA ÁREA DO EURO 99.1 Noutros Estados-Membros da UE(taxas <strong>de</strong> variação homólogas (%), salvo indicação em contrário)1. Evolução económica e financeira200220032003 T4<strong>2004</strong> T1T2<strong>2004</strong> Fev.Mar.Abr.MaioJun.2001200220032001200220032003 Dez.<strong>2004</strong> Jan.Fev.Mar.Abr.Maio2003 Dez.<strong>2004</strong> Jan.Fev.Mar.Abr.Maio200220032003 T4<strong>2004</strong> T1T2200220032003 T3T4<strong>2004</strong> T1200220032003 T3T4<strong>2004</strong> T1200220032003 T4<strong>2004</strong> T1T2<strong>2004</strong> Fev.Mar.Abr.MaioJun.República Dinamarca Estónia Chipre Letónia Lituânia Hungria Malta Polónia Eslovénia Eslováquia Suécia ReinoChecaUnido1 2 3 4 5 6 7 8 9 10 11 12 13IHPC1.4 2.4 3.6 2.8 2.0 0.4 5.2 3.1 1.9 7.5 3.5 2.0 1.3-0.1 2.0 1.4 4.0 2.9 -1.1 4.7 2.6 0.7 5.7 8.5 2.3 1.40.8 1.3 1.2 3.2 3.5 -1.2 5.4 1.1 1.4 5.0 9.4 1.9 1.32.0 0.7 0.6 1.0 4.3 -1.1 6.8 0.9 1.8 3.7 8.2 0.6 1.32.5 0.8 3.2 1.2 5.8 0.5 7.4 3.3 3.4 3.8 8.0 1.2 1.42.0 0.7 0.6 1.4 4.3 -1.2 7.0 0.9 1.8 3.6 8.4 0.2 1.32.1 0.4 0.7 0.1 4.7 -0.9 6.6 0.5 1.8 3.5 7.9 0.4 1.12.0 0.5 1.5 0.1 5.0 -0.7 7.0 3.6 2.3 3.6 7.8 1.1 1.22.6 1.1 3.7 1.2 6.1 1.0 7.8 3.0 3.5 3.9 8.2 1.5 1.52.7 0.9 4.4 2.4 6.1 1.0 7.5 3.3 4.3 3.9 8.1 1.2 1.6Défice (-)/exce<strong>de</strong>nte (+) das administrações públicas em % do PIB-6.4 3.1 0.3 -2.4 -1.6 -2.1 -4.4 -6.4 -3.5 -2.7 -6.0 2.8 0.7-6.4 1.7 1.8 -4.6 -2.7 -1.4 -9.3 -5.7 -3.6 -1.9 -5.7 0.0 -1.6-12.9 1.5 2.6 -6.3 -1.8 -1.7 -5.9 -9.7 -4.1 -1.8 -3.6 0.7 -3.2Dívida pública bruta em % do PIB25.2 47.8 4.7 64.4 16.2 23.4 53.5 61.8 36.7 26.9 48.7 54.4 38.928.9 47.2 5.7 67.1 15.5 22.8 57.1 61.7 41.2 27.8 43.3 52.6 38.537.6 45.0 5.8 72.2 15.6 21.9 59.0 72.0 45.4 27.1 42.8 51.8 39.8Taxa <strong>de</strong> rendibilida<strong>de</strong> das obrigações <strong>de</strong> dívida pública <strong>de</strong> longo prazo em percentagem anual, média do período4.82 4.52 - 4.75 5.07 4.81 8.24 4.71 6.76 5.27 5.42 4.86 4.944.68 4.35 - 4.75 5.06 4.81 8.36 4.71 6.67 5.14 5.16 4.65 4.844.80 4.30 - 4.79 5.05 4.81 8.65 4.70 6.82 5.01 5.11 4.55 4.884.50 4.10 - 5.17 4.98 4.64 8.04 4.70 6.65 4.99 5.09 4.31 4.764.60 4.30 - 5.17 4.89 4.55 7.89 4.65 7.02 4.83 5.06 4.55 4.994.88 4.46 - 5.17 4.95 4.46 8.25 4.65 7.32 4.77 5.13 4.68 5.15Taxa <strong>de</strong> juro a 3 meses em percentagem anual, média do período2.08 2.22 2.61 3.81 4.21 2.68 13.15 2.94 5.69 6.11 5.98 2.82 4.022.07 2.19 2.61 3.81 4.20 2.66 12.57 2.94 5.37 6.01 5.78 2.73 4.062.06 2.18 2.61 3.84 4.18 2.66 12.58 2.95 5.46 5.80 5.79 2.55 4.172.05 2.14 2.62 3.83 4.33 2.67 12.25 2.93 5.49 5.62 5.71 2.37 4.302.06 2.17 2.62 3.94 4.49 2.69 - 2.90 5.69 4.99 5.35 2.13 4.392.16 2.20 2.61 5.16 4.47 2.70 - 2.90 5.99 4.76 4.91 2.14 4.53PIB real1.7 1.0 7.2 2.0 6.4 6.8 3.5 1.7 1.3 3.4 4.4 2.1 1.83.1 0.4 5.1 2.0 7.5 9.0 2.9 . . 2.3 4.2 1.6 2.23.3 1.1 6.2 2.9 7.5 10.6 3.6 . . 2.5 4.7 2.3 2.93.1 1.1 6.8 3.4 8.8 7.7 . . . 3.7 5.5 3.1 3.4. . . . . 6.9 . . . . . . .Saldo da balança corrente e da balança <strong>de</strong> capital em % do PIB-5.7 2.1 -9.9 -4.7 -6.8 -4.8 -6.8 -0.9 -2.6 1.4 -7.6 4.7 -1.6-6.5 2.8 -12.7 -3.4 -8.3 -6.5 -9.0 -5.2 -2.0 0.1 -0.5 6.3 -1.7-7.4 4.3 -9.8 9.4 -9.5 -4.6 -7.7 2.1 -1.1 1.9 0.8 6.6 -2.1-10.0 1.5 -15.9 -4.9 -9.0 -9.7 -9.1 . -1.3 -0.7 -0.6 6.5 -1.7-2.6 2.9 -10.8 -12.6 -9.0 -8.9 -9.8 . -1.4 0.8 1.7 7.8 -0.9Custos unitários do trabalho- 1.8 4.1 - -0.4 -12.5 9.0 - - 6.5 4.1 0.8 3.1- 1.9 4.6 - 4.9 0.2 . - - . 7.2 0.5 .- 2.5 4.8 - - . - - - - - - .- 0.7 2.7 - - . - - - - - - .- 2.4 4.7 - - . - - - - - - .Taxa <strong>de</strong> <strong>de</strong>semprego harmonizada em % da população activa (c.s.)7.3 4.6 9.5 3.9 12.5 13.6 5.6 7.5 19.8 6.1 18.7 4.9 5.17.8 5.6 10.1 4.5 10.5 12.7 5.8 8.2 19.2 6.5 17.1 5.6 5.08.2 5.9 9.7 4.6 10.5 12.1 5.8 8.6 19.1 6.5 16.6 6.0 4.98.6 5.9 9.4 4.7 10.6 11.7 5.9 8.9 19.1 6.4 16.5 6.3 4.78.8 . 9.1 4.4 10.6 11.4 5.9 8.9 18.9 . 16.3 6.5 .8.6 5.9 9.4 4.7 10.6 11.7 5.9 9.0 19.1 6.4 16.5 6.4 4.78.7 5.9 9.3 4.7 10.6 11.6 5.9 9.0 19.0 6.4 16.5 6.3 4.78.7 5.9 9.2 4.4 10.7 11.5 5.9 8.9 18.9 6.4 16.4 6.4 4.78.7 5.9 9.1 4.2 10.6 11.4 5.9 8.9 18.9 6.4 16.3 6.7 .8.8 . 9.0 4.4 10.5 11.4 5.9 8.9 18.9 . 16.2 6.6 .Fontes: Comissão Europeia (Direcção-Geral dos Assuntos Económicos e Financeiros e Eurostat); dados nacionais, Reuters e cálculos do BCE.BCEBoletim Mensal<strong>Agosto</strong> <strong>2004</strong>E 69