Agosto de 2004
Agosto de 2004
Agosto de 2004

Create successful ePaper yourself
Turn your PDF publications into a flip-book with our unique Google optimized e-Paper software.
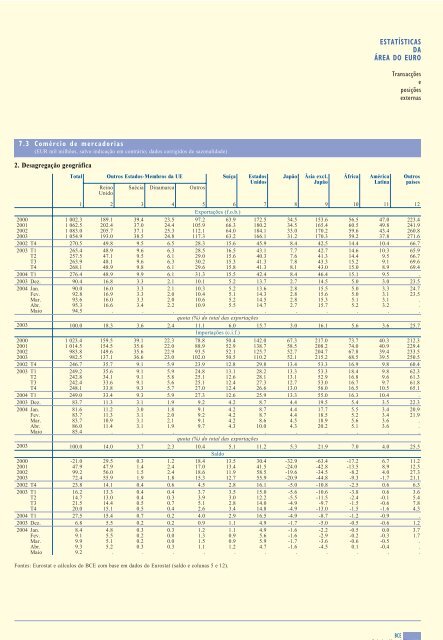
ESTATÍSTICASDAÁREA DO EUROTransacçõeseposiçõesexternas7.3 Comércio <strong>de</strong> mercadorias(EUR mil milhões, salvo indicação em contrário; dados corrigidos <strong>de</strong> sazonalida<strong>de</strong>)2. Desagregação geográficaTotalReinoUnidoOutros Estados-Membros da UESuécia Dinamarca OutrosSuíçaEstadosUnidosJapãoÁsia excl.JapãoÁfricaAméricaLatinaOutrospaíses20002001200220032002 T42003 T1T2T3T4<strong>2004</strong> T12003 Dez.<strong>2004</strong> Jan.Fev.Mar.Abr.Maio200320002001200220032002 T42003 T1T2T3T4<strong>2004</strong> T12003 Dez.<strong>2004</strong> Jan.Fev.Mar.Abr.Maio200320002001200220032002 T42003 T1T2T3T4<strong>2004</strong> T12003 Dez.<strong>2004</strong> Jan.Fev.Mar.Abr.Maio1 2 3 4 5 6 7 8 9 10 11 12Exportações (f.o.b.)1 002.3 189.1 39.4 23.5 97.2 63.9 172.5 34.5 153.6 56.5 47.0 223.41 062.5 202.4 37.0 24.4 105.9 66.3 180.2 34.5 165.4 60.5 49.8 241.91 083.0 205.7 37.1 25.3 112.1 64.0 184.1 33.0 170.2 59.6 43.4 260.81 054.9 193.0 38.5 24.8 117.3 63.2 166.1 31.2 170.3 59.2 37.8 271.6270.5 49.8 9.5 6.5 28.3 15.6 45.9 8.4 42.5 14.4 10.4 66.7265.4 48.9 9.6 6.3 28.5 16.5 43.1 7.7 42.7 14.6 10.3 65.9257.5 47.1 9.5 6.1 29.0 15.6 40.3 7.6 41.3 14.4 9.5 66.7263.9 48.1 9.6 6.3 30.2 15.3 41.3 7.8 43.3 15.2 9.1 69.6268.1 48.9 9.8 6.1 29.6 15.8 41.3 8.1 43.0 15.0 8.9 69.4276.4 48.9 9.9 6.1 31.3 15.5 42.4 8.4 46.4 15.1 9.5 .90.4 16.8 3.3 2.1 10.1 5.2 13.7 2.7 14.5 5.0 3.0 23.590.0 16.0 3.3 2.1 10.3 5.2 13.6 2.8 15.5 5.0 3.3 24.792.8 16.9 3.3 2.0 10.4 5.1 14.3 2.8 15.6 5.0 3.1 23.593.6 16.0 3.3 2.0 10.6 5.2 14.5 2.8 15.3 5.1 3.1 .95.3 16.6 3.4 2.2 10.9 5.5 14.7 2.7 15.7 5.2 3.2 .94.5 . . . . . . . . . . .quota (%) do total das exportações100.0 18.3 3.6 2.4 11.1 6.0 15.7 3.0 16.1 5.6 3.6 25.7Importações (c.i.f.)1 023.4 159.5 39.1 22.3 78.8 50.4 142.0 67.3 217.0 73.7 40.3 212.31 014.5 154.5 35.6 22.0 88.9 52.9 138.7 58.5 208.2 74.0 40.9 229.4983.8 149.6 35.6 22.9 93.5 52.1 125.7 52.7 204.7 67.8 39.4 233.5982.5 137.1 36.6 23.0 102.0 50.5 110.2 52.1 215.2 68.5 39.5 250.5246.7 35.7 9.1 5.9 23.9 12.8 29.8 13.4 53.3 16.9 9.8 60.4249.2 35.6 9.1 5.9 24.8 13.1 28.2 13.3 53.3 18.4 9.8 62.3242.8 34.1 9.1 5.8 25.1 12.6 28.1 13.1 52.9 16.8 9.6 61.3242.4 33.6 9.1 5.6 25.1 12.4 27.3 12.7 53.0 16.7 9.7 61.8248.1 33.8 9.3 5.7 27.0 12.4 26.6 13.0 56.0 16.5 10.5 65.1249.0 33.4 9.3 5.9 27.3 12.6 25.9 13.3 55.0 16.3 10.4 .83.7 11.3 3.1 1.9 9.2 4.2 8.7 4.4 19.5 5.4 3.5 22.381.6 11.2 3.0 1.8 9.1 4.2 8.7 4.4 17.7 5.5 3.4 20.983.7 11.3 3.1 2.0 9.2 4.2 8.7 4.4 18.5 5.2 3.4 21.983.7 10.9 3.1 2.1 9.1 4.2 8.6 4.5 18.9 5.6 3.6 .86.0 11.4 3.1 1.9 9.7 4.3 10.0 4.3 20.2 5.1 3.6 .85.4 . . . . . . . . . . .quota (%) do total das exportações100.0 14.0 3.7 2.3 10.4 5.1 11.2 5.3 21.9 7.0 4.0 25.5Saldo-21.0 29.5 0.3 1.2 18.4 13.5 30.4 -32.9 -63.4 -17.2 6.7 11.247.9 47.9 1.4 2.4 17.0 13.4 41.5 -24.0 -42.8 -13.5 8.9 12.599.2 56.0 1.5 2.4 18.6 11.9 58.5 -19.6 -34.5 -8.2 4.0 27.372.4 55.9 1.9 1.8 15.3 12.7 55.9 -20.9 -44.8 -9.3 -1.7 21.123.8 14.1 0.4 0.6 4.5 2.8 16.1 -5.0 -10.8 -2.5 0.6 6.316.2 13.3 0.4 0.4 3.7 3.5 15.0 -5.6 -10.6 -3.8 0.6 3.614.7 13.0 0.4 0.3 3.9 3.0 12.2 -5.5 -11.5 -2.4 -0.1 5.421.5 14.4 0.5 0.7 5.1 2.8 14.0 -4.9 -9.7 -1.5 -0.6 7.820.0 15.1 0.5 0.4 2.6 3.4 14.8 -4.9 -13.0 -1.5 -1.6 4.327.5 15.4 0.7 0.2 4.0 2.9 16.5 -4.9 -8.7 -1.2 -0.9 .6.8 5.5 0.2 0.2 0.9 1.1 4.9 -1.7 -5.0 -0.5 -0.6 1.28.4 4.8 0.3 0.3 1.2 1.1 4.9 -1.6 -2.2 -0.5 0.0 3.79.1 5.5 0.2 0.0 1.3 0.9 5.6 -1.6 -2.9 -0.2 -0.3 1.79.9 5.1 0.2 0.0 1.5 0.9 5.9 -1.7 -3.6 -0.6 -0.5 .9.3 5.2 0.3 0.3 1.1 1.2 4.7 -1.6 -4.5 0.1 -0.4 .9.2 . . . . . . . . . . .Fontes: Eurostat e cálculos do BCE com base em dados do Eurostat (saldo e colunas 5 e 12).BCEBoletim Mensal<strong>Agosto</strong> <strong>2004</strong>E 63