Agosto de 2004
Agosto de 2004
Agosto de 2004

You also want an ePaper? Increase the reach of your titles
YUMPU automatically turns print PDFs into web optimized ePapers that Google loves.
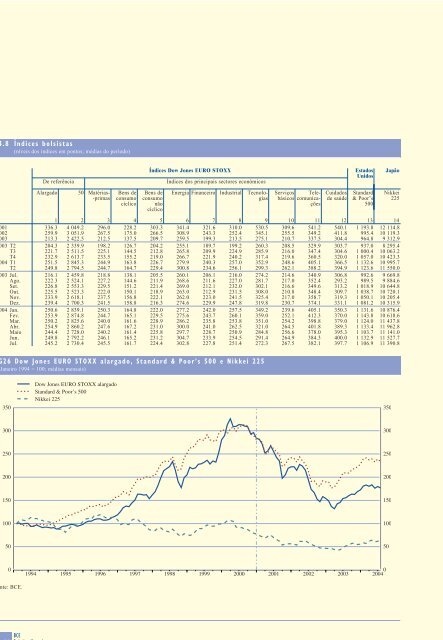
4.8 Índices bolsistas(níveis dos índices em pontos; médias do período)2001200220032003 T2T3T4<strong>2004</strong> T1T22003 Jul.Ago.Set.Out.Nov.Dez.<strong>2004</strong> Jan.Fev.Mar.Abr.MaioJun.Jul.De referênciaAlargado 50 Matérias--primasBens <strong>de</strong>consumocíclicoÍndices Dow Jones EURO STOXXBens <strong>de</strong>consumonãocíclicoÍndices dos principais sectores económicosEnergia Financeiro Industrial TecnologiasServiços Tele-básicos comunica-çõesCuidados<strong>de</strong> saú<strong>de</strong>EstadosUnidosStandard& Poor’s5001 2 3 4 5 6 7 8 9 10 11 12 13 14336.3 4 049.2 296.0 228.2 303.3 341.4 321.6 310.0 530.5 309.6 541.2 540.1 1 193.8 12 114.8259.9 3 051.9 267.5 175.0 266.5 308.9 243.3 252.4 345.1 255.5 349.2 411.8 995.4 10 119.3213.3 2 422.5 212.5 137.5 209.7 259.5 199.3 213.5 275.1 210.7 337.5 304.4 964.8 9 312.9204.3 2 339.9 198.2 126.7 204.2 255.1 189.7 199.2 260.3 208.5 329.9 303.7 937.0 8 295.4221.7 2 511.5 225.1 144.5 212.8 265.8 209.9 224.9 285.9 216.0 347.4 304.6 1 000.4 10 063.2232.9 2 613.7 233.5 155.2 219.0 266.7 221.9 240.2 317.4 219.6 360.5 320.0 1 057.0 10 423.3251.5 2 845.3 244.9 163.8 226.7 279.9 240.3 257.0 352.9 248.6 405.1 366.5 1 132.6 10 995.7249.8 2 794.5 244.7 164.7 229.4 300.8 234.6 256.1 299.3 262.1 388.2 394.9 1 123.6 11 550.0216.1 2 459.8 218.8 138.1 205.5 260.1 206.1 216.0 274.2 214.6 340.9 306.8 992.6 9 669.8222.3 2 524.1 227.2 144.6 211.9 268.6 211.6 227.0 281.7 217.0 352.4 293.2 989.5 9 884.6226.8 2 553.3 229.5 151.2 221.4 269.0 212.1 232.0 302.1 216.6 349.6 313.2 1 018.9 10 644.8225.5 2 523.3 222.0 150.1 218.9 263.0 212.9 231.5 308.0 210.8 348.4 309.7 1 038.7 10 720.1233.9 2 618.1 237.5 156.8 222.1 262.0 223.0 241.5 325.4 217.0 358.7 319.3 1 050.1 10 205.4239.4 2 700.3 241.5 158.8 216.3 274.6 229.9 247.8 319.8 230.7 374.1 331.1 1 081.2 10 315.9250.6 2 839.1 250.3 164.8 222.0 277.2 242.0 257.5 349.2 239.6 405.1 350.3 1 131.6 10 876.4253.9 2 874.8 244.7 165.1 229.5 275.6 243.7 260.1 359.0 252.1 412.3 370.0 1 143.8 10 618.6250.2 2 825.6 240.0 161.6 228.9 286.2 235.8 253.8 351.0 254.2 398.8 379.0 1 124.0 11 437.8254.9 2 860.2 247.6 167.2 231.0 300.0 241.0 262.5 321.0 264.5 401.8 389.3 1 133.4 11 962.8244.4 2 728.0 240.2 161.4 225.8 297.7 228.7 250.9 284.8 256.6 378.0 395.3 1 103.7 11 141.0249.8 2 792.2 246.1 165.2 231.2 304.7 233.9 254.5 291.4 264.9 384.3 400.0 1 132.9 11 527.7245.2 2 730.4 245.5 161.7 224.4 302.8 227.8 251.4 272.3 267.5 382.1 397.7 1 106.9 11 390.8JapãoNikkei225G26 Dow Jones EURO STOXX alargado, Standard & Poor’s 500 e Nikkei 225(Janeiro 1994 = 100; médias mensais)350Dow Jones EURO STOXX alargadoStandard & Poor’s 500Nikkei 2253503003002502502002001501501001005001994 1995 1996 1997 1998 1999 2000 2001 2002 2003 <strong>2004</strong> 0 50Fonte: BCE.BCEBoletim MensalE 42 <strong>Agosto</strong> <strong>2004</strong>