Agosto de 2004
Agosto de 2004
Agosto de 2004

You also want an ePaper? Increase the reach of your titles
YUMPU automatically turns print PDFs into web optimized ePapers that Google loves.
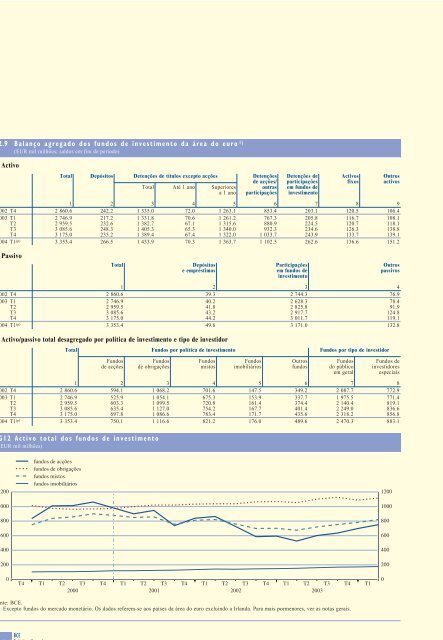
2.9 Balanço agregado dos fundos <strong>de</strong> investimento da área do euro 1)(EUR mil milhões; saldos em fim <strong>de</strong> período)1. Activo2002 T42003 T1T2T3T4TotalDepósitosDetenções <strong>de</strong> títulos excepto acçõesTotal Até 1 ano Superioresa 1 anoDetenções<strong>de</strong> acções/outrasparticipaçõesDetenções <strong>de</strong>participaçõesem fundos <strong>de</strong>investimentoActivosfixosOutrosactivos1 2 3 4 5 6 7 8 92 860.6 242.2 1 335.0 72.0 1 263.1 853.4 203.1 120.5 106.42 746.9 217.2 1 331.8 70.6 1 261.2 767.3 205.8 116.7 108.12 959.5 232.6 1 382.7 67.1 1 315.6 880.9 224.5 120.7 118.13 085.6 248.3 1 405.3 65.3 1 340.0 932.3 234.6 126.3 138.83 175.0 235.2 1 389.4 67.4 1 322.0 1 033.7 243.9 133.7 139.13 353.4 266.5 1 433.9 70.3 1 363.7 1 102.5 262.6 136.6 151.2<strong>2004</strong> T1 (p) Total2. Passivo2002 T42003 T1T2T3T4<strong>2004</strong> T1 (p)TotalDepósitose empréstimosParticipaçõesem fundos <strong>de</strong>investimentoOutrospassivos12342 860.6 39.3 2 744.3 76.92 746.9 40.2 2 628.3 78.42 959.5 41.8 2 825.8 91.93 085.6 43.2 2 917.7 124.83 175.0 44.2 3 011.7 119.13 353.4 49.6 3 171.0 132.83. Activo/passivo total <strong>de</strong>sagregado por política <strong>de</strong> investimento e tipo <strong>de</strong> investidor2002 T42003 T1T2T3T4<strong>2004</strong> T1 (p)Fundos<strong>de</strong> acçõesFundos<strong>de</strong> obrigaçõesG12 Activo total dos fundos <strong>de</strong> investimento(EUR mil milhões)Fundos por política <strong>de</strong> investimentoFundosmistosFundosimobiliáriosOutrosfundosFundos por tipo <strong>de</strong> investidorFundosdo públicoem geralFundos <strong>de</strong>investidoresespeciais1 2 3 4 5 6 7 82 860.6 594.1 1 068.2 701.6 147.5 349.2 2 087.7 772.92 746.9 525.9 1 054.1 675.3 153.9 337.7 1 975.5 771.42 959.5 603.3 1 099.5 720.8 161.4 374.4 2 140.4 819.13 085.6 635.4 1 127.0 754.2 167.7 401.4 2 249.0 836.63 175.0 697.8 1 086.6 783.4 171.7 435.6 2 318.2 856.83 353.4 750.1 1 116.6 821.2 176.0 489.6 2 470.3 883.1120010008006004002000fundos <strong>de</strong> acçõesfundos <strong>de</strong> obrigaçõesfundos mistosfundos imobiliáriosT4 T1 T2 T3 T4 T1 T2 T3 T4 T1 T2 T3 T4 T1 T2 T3 T4 T12000 2001 2002 2003120010008006004002000Fonte: BCE.1) Excepto fundos do mercado monetário. Os dados referem-se aos países da área do euro excluindo a Irlanda. Para mais pormenores, ver as notas gerais.BCEBoletim MensalE 24 <strong>Agosto</strong> <strong>2004</strong>