- Page 1 and 2:
Proceedings of the 10 th European C
- Page 3 and 4:
Contents Paper Title Author(s) Page
- Page 5 and 6:
Paper Title Author(s) Page No. A Qu
- Page 7 and 8:
The Project Mobile Game Based Learn
- Page 9 and 10:
Extreme Scaffolding in the Teaching
- Page 11 and 12:
Malaysia); Tuomo Kakkonen (Universi
- Page 13 and 14:
Preface These Proceedings represent
- Page 15 and 16:
Mini Track Chairs Dr Antonios Andre
- Page 17 and 18:
Cornélia Castro is a PhD student i
- Page 19 and 20:
Manuel Frutos-Perez is the Leader o
- Page 21 and 22:
David Mathew works at the Centre fo
- Page 23 and 24:
Research interests include the inve
- Page 25:
Novita Yulianti is a PhD student at
- Page 28 and 29:
Peter Mozelius et al. searching and
- Page 30 and 31:
Peter Mozelius et al. Error Handli
- Page 32 and 33:
Peter Mozelius et al. were no chanc
- Page 34 and 35:
Peter Mozelius et al. single login
- Page 36 and 37:
Antoinette Muntjewerff for every st
- Page 38 and 39:
Antoinette Muntjewerff All of this
- Page 40 and 41:
Figure 1: Metadata editor Antoinett
- Page 42 and 43:
Antoinette Muntjewerff The structur
- Page 44 and 45:
A Framework for Decision Support fo
- Page 46 and 47:
Phelim Murnion and Markus Helfert i
- Page 48 and 49:
Phelim Murnion and Markus Helfert 4
- Page 50 and 51:
Phelim Murnion and Markus Helfert s
- Page 52 and 53:
Phelim Murnion and Markus Helfert P
- Page 54 and 55:
Shekhar Murthy and Devi Murthy wisd
- Page 56 and 57:
Shekhar Murthy and Devi Murthy educ
- Page 58 and 59:
Shekhar Murthy and Devi Murthy Figu
- Page 60 and 61:
Shekhar Murthy and Devi Murthy corr
- Page 62 and 63:
Shekhar Murthy and Devi Murthy Figu
- Page 64 and 65:
Shekhar Murthy and Devi Murthy Stag
- Page 66 and 67:
7. Conclusions Shekhar Murthy and D
- Page 68 and 69:
Student's Characteristics for Note
- Page 70 and 71:
Minoru Nakayama et al. Learning exp
- Page 72 and 73:
Minoru Nakayama et al. 3.3 Effectiv
- Page 74 and 75:
Minoru Nakayama et al. Table 2: Cor
- Page 76 and 77:
Freeing Education Within and Beyond
- Page 78 and 79:
Chrissi Nerantzi The aim was to exp
- Page 80 and 81:
Chrissi Nerantzi agreeing with Nova
- Page 82 and 83:
Chrissi Nerantzi familiarisation wi
- Page 84 and 85:
Chrissi Nerantzi Scardamalia, M. an
- Page 86 and 87:
Paul Newbury et al. the slides or w
- Page 88 and 89:
Paul Newbury et al. multimedia faci
- Page 90 and 91:
Paul Newbury et al. It is designed
- Page 92 and 93:
Paul Newbury et al. Download figur
- Page 94 and 95:
Paul Newbury et al. “Has the fact
- Page 96 and 97:
eSubmission - UK Policies, Practice
- Page 98 and 99:
Barbara Newland et al. managing stu
- Page 100 and 101:
Figure 3: Technical infrastructure
- Page 102 and 103:
Barbara Newland et al. and I strong
- Page 104 and 105:
Harnessing the Internet for Authent
- Page 106 and 107:
Abel Nyamapfene As stated on the co
- Page 108 and 109:
Abel Nyamapfene 8. There were suffi
- Page 110 and 111:
Abel Nyamapfene Mulnix, J. W. (2011
- Page 112 and 113:
Maruff Akinwale Oladejo and Adelua
- Page 114 and 115:
2.3 Instrumentation Maruff Akinwale
- Page 116 and 117:
Maruff Akinwale Oladejo and Adelua
- Page 118 and 119:
References Maruff Akinwale Oladejo
- Page 120 and 121:
Adelua Olajide Olawole and Maruff A
- Page 122 and 123:
2.2 Sample and sampling techniques
- Page 124 and 125:
3.1 Result Adelua Olajide Olawole a
- Page 126 and 127:
Adelua Olajide Olawole and Maruff A
- Page 128 and 129:
Fatemeh Orooji et al. awareness and
- Page 130 and 131:
Fatemeh Orooji et al. Figure 1: The
- Page 132 and 133:
Fatemeh Orooji et al. Sensing/intu
- Page 134 and 135:
Fatemeh Orooji et al. lower and upp
- Page 136 and 137:
Fatemeh Orooji et al. the other dim
- Page 138 and 139:
Using Lifeworld-led Multimedia to E
- Page 140 and 141:
Andy Pulman et al. A key feature of
- Page 142 and 143:
Andy Pulman et al. in this case “
- Page 144 and 145:
Andy Pulman et al. The Research Evi
- Page 146 and 147:
The Project Mobile Game Based Learn
- Page 148 and 149:
Thomas Putz A hybrid game, consisti
- Page 150 and 151:
3.3 The different ‘events’ supp
- Page 152 and 153:
4. Pedagogical impacts Thomas Putz
- Page 154 and 155:
Thomas Putz Fabricatore, C. (2000).
- Page 156 and 157:
Ricardo Queirós and José Paulo Le
- Page 158 and 159:
Ricardo Queirós and José Paulo Le
- Page 160 and 161:
3.6 Discussion Topics Ricardo Queir
- Page 162 and 163:
Ricardo Queirós and José Paulo Le
- Page 164 and 165:
The Design and Development of an eL
- Page 166 and 167:
Andrik Rampun and Trevor Barker as
- Page 168 and 169:
Andrik Rampun and Trevor Barker add
- Page 170 and 171:
Figure 5: Screen shot of a user’s
- Page 172 and 173:
Andrik Rampun and Trevor Barker 3.1
- Page 174 and 175:
Andrik Rampun and Trevor Barker cou
- Page 176 and 177:
Kansei Design Model for eLearning:
- Page 178 and 179:
Fauziah Redzuan et al. presentation
- Page 180 and 181:
Fauziah Redzuan et al. A second sur
- Page 182 and 183:
Fauziah Redzuan et al. understand t
- Page 184 and 185:
Fauziah Redzuan et al. to explain t
- Page 186 and 187:
Fauziah Redzuan et al. Websites", P
- Page 188 and 189: Changing Teacher Beliefs Through IC
- Page 190 and 191: Bart Rienties et al. substantial di
- Page 192 and 193: Bart Rienties et al. videoed for re
- Page 194 and 195: 5. Discussion Bart Rienties et al.
- Page 196 and 197: Moodle and Affective Computing: Kno
- Page 198 and 199: Manuel Rodrigues et al. Moodle does
- Page 200 and 201: Manuel Rodrigues et al. Other sever
- Page 202 and 203: Manuel Rodrigues et al. Doing this
- Page 204 and 205: Using Google Applications to Facili
- Page 206 and 207: Eleni Rossiou and Erasmia Papadopou
- Page 208 and 209: Eleni Rossiou and Erasmia Papadopou
- Page 210 and 211: Eleni Rossiou and Erasmia Papadopou
- Page 212 and 213: Eleni Rossiou and Erasmia Papadopou
- Page 214 and 215: Eleni Rossiou and Erasmia Papadopou
- Page 216 and 217: Andrée Roy determines if eLearning
- Page 218 and 219: Andrée Roy Table 3: Profiles of eL
- Page 220 and 221: Andrée Roy the cost of production
- Page 222 and 223: Andrée Roy Lawless, N., Allan, J.
- Page 224 and 225: Zuzana Šaffková comment metacogni
- Page 226 and 227: Zuzana Šaffková Moodle applicatio
- Page 228 and 229: Zuzana Šaffková the other propert
- Page 230 and 231: Zuzana Šaffková In the last phase
- Page 232 and 233: Zuzana Šaffková prior knowledge,
- Page 234 and 235: A Mobile aid Tool for Crafting Acti
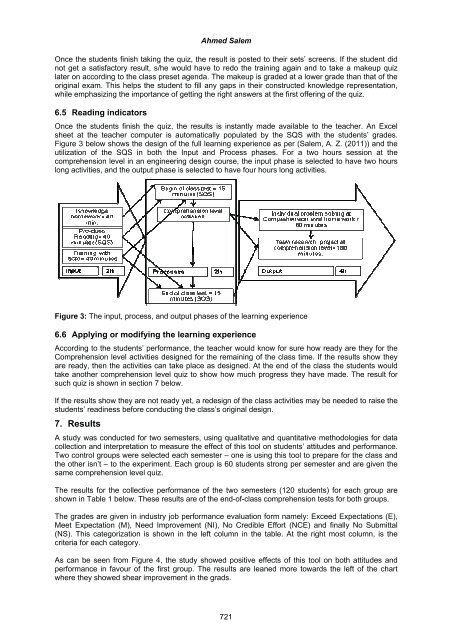
- Page 236 and 237: Ahmed Salem Question difficulty in
- Page 240 and 241: Ahmed Salem Table 1: The two groups
- Page 242 and 243: King-Sized eLearning - how Effectiv
- Page 244 and 245: Marie Sams et al. MOB was set up in
- Page 246 and 247: Marie Sams et al. attaching the new
- Page 248 and 249: Marie Sams et al. include time cons
- Page 250 and 251: Rowena Santiago et al. However, whe
- Page 252 and 253: Rowena Santiago et al. 6.1.2 Assign
- Page 254 and 255: Rowena Santiago et al. the original
- Page 256 and 257: Rowena Santiago et al. Together, th
- Page 258 and 259: Vitor Santos and Luis Amaral To bui
- Page 260 and 261: Vitor Santos and Luis Amaral Althou
- Page 262 and 263: Figure 4: Technical architecture Vi
- Page 264 and 265: Implementing and Evaluating Problem
- Page 266 and 267: Maggi Savin-Baden et al. different
- Page 268 and 269: Maggi Savin-Baden et al. and second
- Page 270 and 271: Maggi Savin-Baden et al. important
- Page 272 and 273: The Evolution of eLearning Platform
- Page 274 and 275: Adriana Schiopoiu Burlea et al. Hyp
- Page 276 and 277: Adriana Schiopoiu Burlea et al. Tab
- Page 278 and 279: Adriana Schiopoiu Burlea et al. Eve
- Page 280 and 281: Teachers’ Skills set for Personal
- Page 282 and 283: Zaffar Ahmed Shaikh and Shakeel Ahm
- Page 284 and 285: Zaffar Ahmed Shaikh and Shakeel Ahm
- Page 286 and 287: 6. Conclusion and recommendations Z
- Page 288 and 289:
Bridging the Feedback Divide Utilis
- Page 290 and 291:
Angela Shapiro and Aidan Johnston f
- Page 292 and 293:
Angela Shapiro and Aidan Johnston F
- Page 294 and 295:
Post-Academic Masters Course in Man
- Page 296 and 297:
4. Discussion and conclusion Cees T
- Page 298 and 299:
Engagement With Students in ‘Midd
- Page 300 and 301:
Anne Smith and Sonya Campbell x y c
- Page 302 and 303:
4.3 Student led connectivity Anne S
- Page 304 and 305:
Figure 2: Conceptualising ‘middle
- Page 306 and 307:
The Learning Management System as a
- Page 308 and 309:
Dina Soeiro et al. He was older, ol
- Page 310 and 311:
Dina Soeiro et al. specially about
- Page 312 and 313:
Can the Medium Extend the Message?
- Page 314 and 315:
Mekala Soosay elements under study,
- Page 316 and 317:
Mekala Soosay to self and peer-asse
- Page 318 and 319:
Mekala Soosay flexible web-based ap
- Page 320 and 321:
Implementation and Analysis of an O
- Page 322 and 323:
Iain Stewart et al. No-one was con
- Page 324 and 325:
Iain Stewart et al. The content sh
- Page 326 and 327:
Iain Stewart et al. entry per stude
- Page 328 and 329:
Iain Stewart et al. Dolnicar, S, Sh
- Page 330 and 331:
2. The research Caroline Stockman a
- Page 332 and 333:
Caroline Stockman and Fred Truyen S
- Page 334 and 335:
Caroline Stockman and Fred Truyen n
- Page 336 and 337:
Caroline Stockman and Fred Truyen s
- Page 338 and 339:
PeerWise - The Marmite of Veterinar
- Page 340 and 341:
Amanda Sykes et al. recently outlin
- Page 342 and 343:
Amanda Sykes et al. activity became
- Page 344 and 345:
Amanda Sykes et al. students either
- Page 346 and 347:
Category Amanda Sykes et al. Q9 : W
- Page 348 and 349:
Amanda Sykes et al. Chang, S-B., Hu
- Page 350 and 351:
Nicolet Theunissen and Hester Stubb
- Page 352 and 353:
Figure 1: Overall structure Nicolet
- Page 354 and 355:
Nicolet Theunissen and Hester Stubb
- Page 356 and 357:
Nicolet Theunissen and Hester Stubb
- Page 358 and 359:
References Nicolet Theunissen and H
- Page 360 and 361:
Tone Vold This idea phase was under
- Page 362 and 363:
Tone Vold process. A synchronous di
- Page 364 and 365:
The Effects of Self-Directed Learni
- Page 366 and 367:
Chien-hwa Wang and Cheng-ping Chen
- Page 368 and 369:
Chien-hwa Wang and Cheng-ping Chen
- Page 370 and 371:
Chien-hwa Wang and Cheng-ping Chen
- Page 372 and 373:
Usage Cases: A Useful way to Improv
- Page 374 and 375:
Cristina Wanzeller and Orlando Belo
- Page 376 and 377:
Cristina Wanzeller and Orlando Belo
- Page 378 and 379:
Cristina Wanzeller and Orlando Belo
- Page 380 and 381:
The Virtual Path to Academic Transi
- Page 382 and 383:
Julie Watson course overall, with s
- Page 384 and 385:
Julie Watson practical and economic
- Page 386 and 387:
6. First phase Julie Watson Followi
- Page 388 and 389:
Identifying and Locating Frames of
- Page 390 and 391:
Ethical approval Katherine Wimpenny
- Page 392 and 393:
Katherine Wimpenny et al. SL was a
- Page 394 and 395:
Katherine Wimpenny et al. This in t
- Page 396 and 397:
Reaction Lecture: Text Messaging to
- Page 398 and 399:
Koos Winnips et al. order to make a
- Page 400 and 401:
Table 2: Overview of student reacti
- Page 402 and 403:
Koos Winnips et al. Students liked
- Page 404 and 405:
A Holistic Approach to Instructiona
- Page 406 and 407:
Li Zhong Zhang There is a wealth of
- Page 408 and 409:
Figure 1: An integrated design fram
- Page 410 and 411:
6.1 Design implications Li Zhong Zh
- Page 412 and 413:
894
- Page 414 and 415:
896
- Page 416 and 417:
Nahla Aljojo et al. Adaptive hyperm
- Page 418 and 419:
Nahla Aljojo et al. Email: The emai
- Page 420 and 421:
Nahla Aljojo et al. Table 3: 16 typ
- Page 422 and 423:
Table 7: The results of pairwise co
- Page 424 and 425:
Nahla Aljojo et al. fact misleading
- Page 426 and 427:
Nahla Aljojo et al. Aljojo, N. & Ad
- Page 428 and 429:
Andy Coverdale media and related on
- Page 430 and 431:
Andy Coverdale A former interdisci
- Page 432 and 433:
Andy Coverdale Whilst new initiativ
- Page 434 and 435:
Andy Coverdale the participant inte
- Page 436 and 437:
Michael Flavin In a subsequent work
- Page 438 and 439:
Michael Flavin labour” nodes) in
- Page 440 and 441:
Michael Flavin The lecturer also sp
- Page 442 and 443:
Michael Flavin Quality Assurance Ag
- Page 444 and 445:
Fortunate Gunzo and Lorenzo Dalvit
- Page 446 and 447:
4. Possible scenarios 4.1 Computer
- Page 448 and 449:
Fortunate Gunzo and Lorenzo Dalvit
- Page 450 and 451:
Collaborative eLearning in a Develo
- Page 452 and 453:
Evelyn Kigozi Kahiigi et al. implem
- Page 454 and 455:
Evelyn Kigozi Kahiigi et al. includ
- Page 456 and 457:
Evelyn Kigozi Kahiigi et al. had ve
- Page 458 and 459:
Evelyn Kigozi Kahiigi et al. consid
- Page 460 and 461:
Evelyn Kigozi Kahiigi et al. So, H.
- Page 462 and 463:
Fabio Serenelli et al. is to identi
- Page 464 and 465:
Figure 3: Screenshots of LO3 - Lear
- Page 466 and 467:
Managing Essential Processing Foste
- Page 468 and 469:
6. Results and analysis Fabio Seren
- Page 470 and 471:
Fabio Serenelli et al. Mangiatordi,
- Page 472 and 473:
1.2 VLE (Virtual Learning Environme
- Page 474 and 475:
Nazime Tuncay and Hüseyin Uzunboyl
- Page 476 and 477:
Nazime Tuncay and Hüseyin Uzunboyl
- Page 478 and 479:
Figure 4 Response Screen Nazime Tun
- Page 480 and 481:
Nazime Tuncay and Hüseyin Uzunboyl
- Page 482 and 483:
Figure 12 An Example of Recorded Vi
- Page 484 and 485:
Figure 15 VirtualNeu General Menus
- Page 486 and 487:
Nazime Tuncay and Hüseyin Uzunboyl
- Page 488 and 489:
Nazime Tuncay and Hüseyin Uzunboyl
- Page 490 and 491:
972
- Page 492 and 493:
Liz Falconer and Manuel Frutos-Pere
- Page 494 and 495:
Liz Falconer and Manuel Frutos-Pere
- Page 496 and 497:
Extreme Scaffolding in the Teaching
- Page 498 and 499:
Dan-Adrian German first exposure to
- Page 500 and 501:
Benefits and Barriers: Applying eLe
- Page 502 and 503:
Simon McGinnes view on demand. OSD
- Page 504 and 505:
986
- Page 506 and 507:
988
- Page 508 and 509:
Olivia Billingham 2010); gains in c
- Page 510 and 511:
Olivia Billingham Deneen, L., (2010
- Page 512 and 513:
Karin Levinsen et al. conference or
- Page 514 and 515:
Karin Levinsen et al. in order to s
- Page 516 and 517:
Peps Mccrea professional engagement
- Page 518 and 519:
A Framework for Understanding Onlin
- Page 520 and 521:
Sónia Sousa et al. little sense re
- Page 522 and 523:
Sónia Sousa et al. Figure 4: The e
- Page 524 and 525:
Trust in Distributed Personal Learn
- Page 526 and 527:
2.2 LePress Sónia Sousa et al. Per
- Page 528 and 529:
Sónia Sousa et al. 3. Elicitation
- Page 530 and 531:
Breaking Down Barriers: Development
- Page 532 and 533:
Karen Strickland et al. qualitative
- Page 534 and 535:
Novita Yulianti et al. Research con


