

here - TIMSS and PIRLS Home - Boston College
here - TIMSS and PIRLS Home - Boston College
here - TIMSS and PIRLS Home - Boston College

Create successful ePaper yourself
Turn your PDF publications into a flip-book with our unique Google optimized e-Paper software.
chapter 3: literacy-related activities in the home<br />
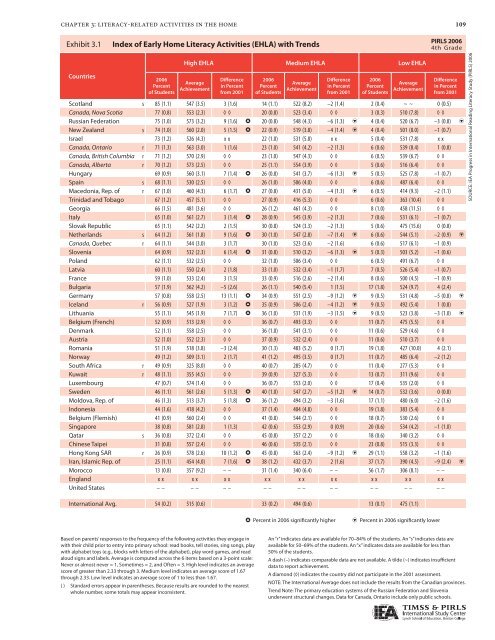
Exhibit 3.1: 3.1 Index Index of of Early Early <strong>Home</strong> Literacy Activities (EHLA) with with Trends<br />
Countries<br />
2006<br />
Percent<br />
of Students<br />
High EHLA Medium EHLA Low EHLA<br />
Average<br />
Achievement<br />
Difference<br />
in Percent<br />
from 2001<br />
2006<br />
Percent<br />
of Students<br />
Average<br />
Achievement<br />
Difference<br />
in Percent<br />
from 2001<br />
2006<br />
Percent<br />
of Students<br />
Average<br />
Achievement<br />
Difference<br />
in Percent<br />
from 2001<br />
Scotl<strong>and</strong> s 85 (1.1) 547 (3.5) 3 (1.6) 14 (1.1) 522 (8.2) –2 (1.4) 2 (0.4) ~ ~ 0 (0.5)<br />
Canada, Nova Scotia 77 (0.8) 553 (2.3) ◊ ◊ 20 (0.8) 523 (3.4) ◊ ◊ 3 (0.3) 510 (7.8) ◊ ◊<br />
Russian Federation 75 (1.0) 573 (3.2) 9 (1.6) h 20 (0.8) 548 (4.3) –6 (1.3) i 4 (0.4) 520 (6.7) –3 (0.8) i<br />
New Zeal<strong>and</strong> s 74 (1.0) 560 (2.0) 5 (1.5) h 22 (0.9) 519 (3.8) –4 (1.4) i 4 (0.4) 501 (8.0) –1 (0.7)<br />
Israel 73 (1.2) 526 (4.3) x x 22 (1.0) 531 (5.8) x x 5 (0.4) 531 (7.8) x x<br />
Canada, Ontario r 71 (1.3) 563 (3.0) 1 (1.6) 23 (1.0) 541 (4.2) –2 (1.3) 6 (0.6) 539 (8.4) 1 (0.8)<br />
Canada, British Columbia r 71 (1.2) 570 (2.9) ◊ ◊ 23 (1.0) 547 (4.3) ◊ ◊ 6 (0.5) 539 (6.7) ◊ ◊<br />
Canada, Alberta r 70 (1.2) 573 (2.5) ◊ ◊ 25 (1.1) 554 (3.9) ◊ ◊ 5 (0.6) 516 (6.4) ◊ ◊<br />
Hungary 69 (0.9) 560 (3.1) 7 (1.4) h 26 (0.8) 541 (3.7) –6 (1.3) i 5 (0.5) 525 (7.8) –1 (0.7)<br />
Spain s 68 (1.1) 530 (2.5) ◊ ◊ 26 (1.0) 506 (4.0) ◊ ◊ 6 (0.6) 487 (6.4) ◊ ◊<br />
Macedonia, Rep. of r 67 (1.0) 460 (4.3) 6 (1.7) h 27 (0.8) 431 (5.0) –4 (1.3) i 6 (0.5) 414 (9.3) –2 (1.1)<br />
Trinidad <strong>and</strong> Tobago 67 (1.2) 457 (5.1) ◊ ◊ 27 (0.9) 416 (5.3) ◊ ◊ 6 (0.6) 363 (10.4) ◊ ◊<br />
Georgia 66 (1.5) 481 (3.6) ◊ ◊ 26 (1.2) 461 (4.3) ◊ ◊ 8 (1.0) 458 (11.5) ◊ ◊<br />
Italy 65 (1.0) 561 (2.7) 3 (1.4) h 28 (0.9) 545 (3.9) –2 (1.3) 7 (0.6) 531 (6.1) –1 (0.7)<br />
Slovak Republic 65 (1.1) 542 (2.2) 2 (1.5) 30 (0.8) 524 (3.3) –2 (1.3) 5 (0.6) 475 (15.6) 0 (0.8)<br />
Netherl<strong>and</strong>s s 64 (1.2) 561 (1.8) 9 (1.6) h 30 (1.0) 547 (2.8) –7 (1.4) i 6 (0.6) 544 (5.1) –2 (0.9) i<br />
Canada, Quebec r 64 (1.1) 544 (3.0) 3 (1.7) 30 (1.0) 523 (3.6) –2 (1.6) 6 (0.6) 517 (6.1) –1 (0.9)<br />
Slovenia 64 (0.9) 532 (2.3) 6 (1.4) h 31 (0.8) 510 (3.2) –6 (1.3) i 5 (0.3) 503 (5.2) –1 (0.6)<br />
Pol<strong>and</strong> 62 (1.1) 532 (2.5) ◊ ◊ 32 (1.0) 506 (3.4) ◊ ◊ 6 (0.5) 491 (6.7) ◊ ◊<br />
Latvia 60 (1.1) 550 (2.4) 2 (1.8) 33 (1.0) 532 (3.4) –1 (1.7) 7 (0.5) 526 (5.4) –1 (0.7)<br />
France 59 (1.0) 533 (2.4) 3 (1.5) 33 (0.9) 516 (2.6) –2 (1.4) 8 (0.6) 500 (4.5) –1 (0.9)<br />
Bulgaria 57 (1.9) 562 (4.2) –5 (2.6) 26 (1.1) 540 (5.4) 1 (1.5) 17 (1.8) 524 (9.7) 4 (2.4)<br />
Germany 57 (0.8) 558 (2.5) 13 (1.1) h 34 (0.9) 551 (2.5) –9 (1.2) i 9 (0.5) 531 (4.8) –5 (0.8) i<br />
Icel<strong>and</strong> r 56 (0.9) 527 (1.9) 3 (1.2) h 35 (0.9) 506 (2.4) –4 (1.2) i 9 (0.5) 492 (5.4) 1 (0.8)<br />
Lithuania 55 (1.1) 545 (1.9) 7 (1.7) h 36 (1.0) 531 (1.9) –3 (1.5) i 9 (0.5) 523 (3.8) –3 (1.0) i<br />
Belgium (French) 52 (0.9) 513 (2.9) ◊ ◊ 36 (0.7) 493 (3.3) ◊ ◊ 11 (0.7) 475 (5.5) ◊ ◊<br />
Denmark 52 (1.1) 558 (2.5) ◊ ◊ 36 (1.0) 541 (3.1) ◊ ◊ 11 (0.6) 529 (4.6) ◊ ◊<br />
Austria 52 (1.0) 552 (2.3) ◊ ◊ 37 (0.9) 532 (2.4) ◊ ◊ 11 (0.6) 510 (3.7) ◊ ◊<br />
Romania 51 (1.9) 518 (3.8) –3 (2.4) 30 (1.3) 483 (5.2) 0 (1.7) 19 (1.8) 427 (10.0) 4 (2.1)<br />
Norway 49 (1.2) 509 (3.1) 2 (1.7) 41 (1.2) 495 (3.5) 0 (1.7) 11 (0.7) 485 (6.4) –2 (1.2)<br />
South Africa r 49 (0.9) 325 (8.0) ◊ ◊ 40 (0.7) 285 (4.7) ◊ ◊ 11 (0.4) 277 (5.3) ◊ ◊<br />
Kuwait r 48 (1.1) 355 (4.5) ◊ ◊ 39 (0.9) 327 (5.3) ◊ ◊ 13 (0.7) 311 (9.6) ◊ ◊<br />
Luxembourg 47 (0.7) 574 (1.4) ◊ ◊ 36 (0.7) 553 (2.0) ◊ ◊ 17 (0.4) 535 (2.0) ◊ ◊<br />
Sweden 46 (1.1) 561 (2.6) 5 (1.3) h 40 (1.0) 547 (2.7) –5 (1.2) i 14 (0.7) 532 (3.6) 0 (0.8)<br />
Moldova, Rep. of 46 (1.3) 513 (3.7) 5 (1.8) h 36 (1.2) 494 (3.2) –3 (1.6) 17 (1.1) 480 (6.0) –2 (1.6)<br />
Indonesia 44 (1.6) 418 (4.2) ◊ ◊ 37 (1.4) 404 (4.8) ◊ ◊ 19 (1.8) 383 (5.4) ◊ ◊<br />
Belgium (Flemish) 41 (0.9) 560 (2.4) ◊ ◊ 41 (0.8) 544 (2.1) ◊ ◊ 18 (0.7) 530 (2.6) ◊ ◊<br />
Singapore 38 (0.8) 581 (2.8) 1 (1.3) 42 (0.6) 553 (2.9) 0 (0.9) 20 (0.6) 534 (4.2) –1 (1.0)<br />
Qatar s 36 (0.8) 372 (2.4) ◊ ◊ 45 (0.8) 357 (2.2) ◊ ◊ 18 (0.6) 340 (3.2) ◊ ◊<br />
Chinese Taipei 31 (0.8) 557 (2.4) ◊ ◊ 46 (0.6) 535 (2.1) ◊ ◊ 23 (0.8) 515 (3.3) ◊ ◊<br />
Hong Kong SAR r 26 (0.9) 578 (2.6) 10 (1.2) h 45 (0.8) 563 (2.4) –9 (1.2) i 29 (1.1) 558 (3.2) –1 (1.6)<br />
Iran, Islamic Rep. of 25 (1.1) 454 (4.0) 7 (1.6) h 38 (1.2) 432 (3.7) 2 (1.6) 37 (1.7) 390 (4.5) –9 (2.4) i<br />
Morocco 13 (0.8) 357 (9.2) – – 31 (1.4) 340 (6.4) – – 56 (1.7) 306 (8.1) – –<br />
Engl<strong>and</strong> x x x x x x x x x x x x x x x x x x<br />
United States – – – – – – – – – – – – – – – – – –<br />
International Avg. 54 (0.2) 515 (0.6) 33 (0.2) 494 (0.6) 13 (0.1) 475 (1.1)<br />
Based on parents’ responses to the frequency of the following activities they engage in<br />
with their child prior to entry into primary school: read books, tell stories, sing songs, play<br />
with alphabet toys (e.g., blocks with letters of the alphabet), play word games, <strong>and</strong> read<br />
aloud signs <strong>and</strong> labels. Average is computed across the 6 items based on a 3-point scale:<br />
Never or almost never = 1, Sometimes = 2, <strong>and</strong> Often = 3. High level indicates an average<br />
score of greater than 2.33 through 3. Medium level indicates an average score of 1.67<br />
through 2.33. Low level indicates an average score of 1 to less than 1.67.<br />
( ) St<strong>and</strong>ard errors appear in parentheses. Because results are rounded to the nearest<br />
whole number, some totals may appear inconsistent.<br />
h Percent in 2006 significantly higher i Percent in 2006 significantly lower<br />
An “r” indicates data are available for 70–84% of the students. An “s” indicates data are<br />
available for 50–69% of the students. An “x” indicates data are available for less than<br />
50% of the students.<br />
A dash (–) indicates comparable data are not available. A tilde (~) indicates insufficient<br />
data to report achievement.<br />
A diamond (◊) indicates the country did not participate in the 2001 assessment.<br />
109<br />
<strong>PIRLS</strong> 2006<br />
4th Grade<br />
NOTE: The International Average does not include the results from the Canadian provinces.<br />
Trend Note: The primary education systems of the Russian Federation <strong>and</strong> Slovenia<br />
underwent structural changes. Data for Canada, Ontario include only public schools.<br />
SOURCE: IEA Progress in International Reading Literacy Study (<strong>PIRLS</strong>) 2006


