

here - TIMSS and PIRLS Home - Boston College
here - TIMSS and PIRLS Home - Boston College
here - TIMSS and PIRLS Home - Boston College

You also want an ePaper? Increase the reach of your titles
YUMPU automatically turns print PDFs into web optimized ePapers that Google loves.
276 chapter 7: school contexts<br />
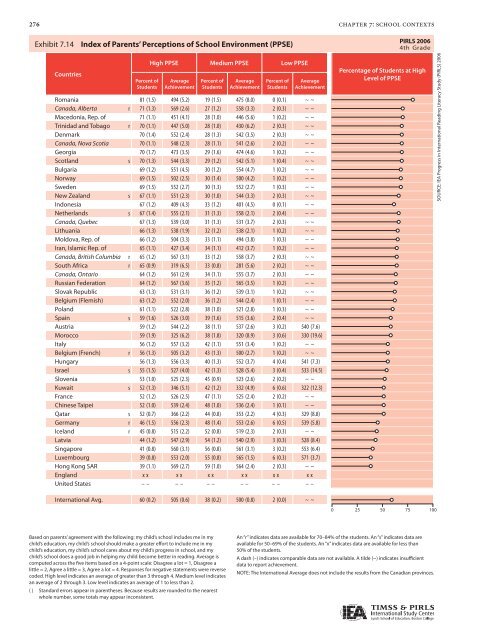
Exhibit Exhibit 7.147.14: Index Index of Parents’ of Parents’ Perceptions of School of School Environment (PPSE) (PPSE)<br />
Countries<br />
Percent of<br />
Students<br />
High PPSE Medium PPSE Low PPSE<br />
Average<br />
Achievement<br />
Percent of<br />
Students<br />
Average<br />
Achievement<br />
Percent of<br />
Students<br />
Average<br />
Achievement<br />
Romania 81 (1.5) 494 (5.2) 19 (1.5) 475 (8.0) 0 (0.1) ~ ~<br />
Canada, Alberta r 71 (1.3) 569 (2.6) 27 (1.2) 558 (3.3) 2 (0.3) ~ ~<br />
Macedonia, Rep. of 71 (1.1) 451 (4.1) 28 (1.0) 446 (5.6) 1 (0.2) ~ ~<br />
Trinidad <strong>and</strong> Tobago r 70 (1.1) 447 (5.0) 28 (1.0) 430 (6.2) 2 (0.3) ~ ~<br />
Denmark 70 (1.4) 552 (2.4) 28 (1.3) 542 (3.5) 2 (0.3) ~ ~<br />
Canada, Nova Scotia 70 (1.1) 548 (2.3) 28 (1.1) 541 (2.6) 2 (0.2) ~ ~<br />
Georgia 70 (1.7) 473 (3.5) 29 (1.6) 474 (4.6) 1 (0.2) ~ ~<br />
Scotl<strong>and</strong> s 70 (1.3) 544 (3.3) 29 (1.2) 542 (5.1) 1 (0.4) ~ ~<br />
Bulgaria 69 (1.2) 551 (4.5) 30 (1.2) 554 (4.7) 1 (0.2) ~ ~<br />
Norway 69 (1.5) 502 (2.5) 30 (1.4) 500 (4.2) 1 (0.2) ~ ~<br />
Sweden 69 (1.5) 552 (2.7) 30 (1.3) 552 (2.7) 1 (0.3) ~ ~<br />
New Zeal<strong>and</strong> s 67 (1.1) 551 (2.3) 30 (1.0) 544 (3.3) 2 (0.3) ~ ~<br />
Indonesia 67 (1.2) 409 (4.3) 33 (1.2) 401 (4.5) 0 (0.1) ~ ~<br />
Netherl<strong>and</strong>s s 67 (1.4) 555 (2.1) 31 (1.3) 558 (2.1) 2 (0.4) ~ ~<br />
Canada, Quebec 67 (1.3) 539 (3.0) 31 (1.3) 531 (3.7) 2 (0.3) ~ ~<br />
Lithuania 66 (1.3) 538 (1.9) 32 (1.2) 538 (2.1) 1 (0.2) ~ ~<br />
Moldova, Rep. of 66 (1.2) 504 (3.3) 33 (1.1) 494 (3.8) 1 (0.3) ~ ~<br />
Iran, Islamic Rep. of 65 (1.1) 427 (3.4) 34 (1.1) 412 (3.7) 1 (0.2) ~ ~<br />
Canada, British Columbia r 65 (1.2) 567 (3.1) 33 (1.2) 558 (3.7) 2 (0.3) ~ ~<br />
South Africa r 65 (0.9) 319 (6.5) 33 (0.8) 281 (5.6) 2 (0.2) ~ ~<br />
Canada, Ontario 64 (1.2) 561 (2.9) 34 (1.1) 555 (3.7) 2 (0.3) ~ ~<br />
Russian Federation 64 (1.2) 567 (3.6) 35 (1.2) 565 (3.5) 1 (0.2) ~ ~<br />
Slovak Republic 63 (1.3) 531 (3.1) 36 (1.2) 539 (3.1) 1 (0.2) ~ ~<br />
Belgium (Flemish) 63 (1.2) 552 (2.0) 36 (1.2) 544 (2.4) 1 (0.1) ~ ~<br />
Pol<strong>and</strong> 61 (1.1) 522 (2.8) 38 (1.0) 521 (2.8) 1 (0.3) ~ ~<br />
Spain s 59 (1.6) 526 (3.0) 39 (1.6) 515 (3.6) 2 (0.4) ~ ~<br />
Austria 59 (1.2) 544 (2.2) 38 (1.1) 537 (2.6) 3 (0.2) 540 (7.6)<br />
Morocco 59 (1.9) 325 (6.2) 38 (1.8) 320 (8.9) 3 (0.6) 330 (19.6)<br />
Italy 56 (1.2) 557 (3.2) 42 (1.1) 551 (3.4) 1 (0.2) ~ ~<br />
Belgium (French) r 56 (1.3) 505 (3.2) 43 (1.3) 500 (2.7) 1 (0.2) ~ ~<br />
Hungary 56 (1.3) 556 (3.3) 40 (1.3) 552 (3.7) 4 (0.4) 541 (7.3)<br />
Israel s 55 (1.5) 527 (4.0) 42 (1.3) 528 (5.4) 3 (0.4) 533 (14.5)<br />
Slovenia 53 (1.0) 525 (2.3) 45 (0.9) 523 (2.6) 2 (0.2) ~ ~<br />
Kuwait s 52 (1.3) 346 (5.1) 42 (1.2) 332 (4.9) 6 (0.6) 322 (12.3)<br />
France 52 (1.2) 526 (2.5) 47 (1.1) 525 (2.4) 2 (0.2) ~ ~<br />
Chinese Taipei 52 (1.0) 539 (2.4) 48 (1.0) 536 (2.4) 1 (0.1) ~ ~<br />
Qatar s 52 (0.7) 366 (2.2) 44 (0.8) 353 (2.2) 4 (0.3) 329 (8.8)<br />
Germany r 46 (1.5) 556 (2.3) 48 (1.4) 553 (2.6) 6 (0.5) 539 (5.8)<br />
Icel<strong>and</strong> r 45 (0.8) 515 (2.2) 52 (0.8) 519 (2.3) 2 (0.3) ~ ~<br />
Latvia 44 (1.2) 547 (2.9) 54 (1.2) 540 (2.9) 3 (0.3) 528 (8.4)<br />
Singapore 41 (0.8) 560 (3.1) 56 (0.8) 561 (3.1) 3 (0.2) 553 (6.4)<br />
Luxembourg 39 (0.8) 553 (2.0) 55 (0.8) 565 (1.5) 6 (0.3) 571 (3.7)<br />
Hong Kong SAR 39 (1.1) 569 (2.7) 59 (1.0) 564 (2.4) 2 (0.3) ~ ~<br />
Engl<strong>and</strong> x x x x x x x x x x x x<br />
United States – – – – – – – – – – – –<br />
International Avg. 60 (0.2) 505 (0.6) 38 (0.2) 500 (0.8) 2 (0.0) ~ ~<br />
Based on parents’ agreement with the following: my child’s school includes me in my<br />
child’s education, my child’s school should make a greater effort to include me in my<br />
child’s education, my child’s school cares about my child’s progress in school, <strong>and</strong> my<br />
child’s school does a good job in helping my child become better in reading. Average is<br />
computed across the five items based on a 4-point scale: Disagree a lot = 1, Disagree a<br />
little = 2, Agree a little = 3, Agree a lot = 4. Responses for negative statements were reverse<br />
coded. High level indicates an average of greater than 3 through 4. Medium level indicates<br />
an average of 2 through 3. Low level indicates an average of 1 to less than 2.<br />
( ) St<strong>and</strong>ard errors appear in parentheses. Because results are rounded to the nearest<br />
whole number, some totals may appear inconsistent.<br />
<strong>PIRLS</strong> 2006<br />
4th Grade<br />
Percentage of Students at High<br />
Level of PPSE<br />
0 25 50 75 100<br />
An “r” indicates data are available for 70–84% of the students. An “s” indicates data are<br />
available for 50–69% of the students. An “x” indicates data are available for less than<br />
50% of the students.<br />
A dash (–) indicates comparable data are not available. A tilde (~) indicates insufficient<br />
data to report achievement.<br />
NOTE: The International Average does not include the results from the Canadian provinces.<br />
SOURCE: IEA Progress in International Reading Literacy Study (<strong>PIRLS</strong>) 2006


