

here - TIMSS and PIRLS Home - Boston College
here - TIMSS and PIRLS Home - Boston College
here - TIMSS and PIRLS Home - Boston College

You also want an ePaper? Increase the reach of your titles
YUMPU automatically turns print PDFs into web optimized ePapers that Google loves.
chapter 6: teachers <strong>and</strong> reading instruction<br />
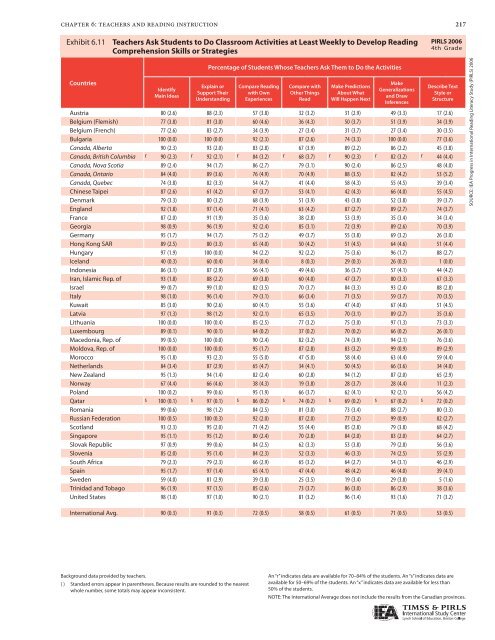
Exhibit 6.11: 6.11 Teachers Ask Students to to Do Do Classroom Activities at at Least Weekly to to Develop Reading<br />
Comprehension Comprehension Skills or Strategies Skills or Strategies<br />
Countries<br />
Identify<br />
Main Ideas<br />
Percentage of Students Whose Teachers Ask Them to Do the Activities<br />
Explain or<br />
Support Their<br />
Underst<strong>and</strong>ing<br />
Compare Reading<br />
with Own<br />
Experiences<br />
Compare with<br />
Other Things<br />
Read<br />
Make Predictions<br />
About What<br />
Will Happen Next<br />
Make<br />
Generalizations<br />
<strong>and</strong> Draw<br />
Inferences<br />
Describe Text<br />
Style or<br />
Structure<br />
Austria 80 (2.6) 88 (2.3) 57 (3.8) 32 (3.2) 31 (2.9) 49 (3.3) 17 (2.6)<br />
Belgium (Flemish) 77 (3.8) 81 (3.0) 60 (4.6) 36 (4.3) 50 (3.7) 51 (3.9) 34 (3.9)<br />
Belgium (French) 77 (2.6) 83 (2.7) 34 (3.9) 27 (3.4) 31 (3.7) 27 (3.4) 30 (3.5)<br />
Bulgaria 100 (0.0) 100 (0.0) 92 (2.3) 87 (2.6) 74 (3.3) 100 (0.0) 77 (3.6)<br />
Canada, Alberta 90 (2.3) 93 (2.0) 83 (2.8) 67 (3.9) 89 (2.2) 86 (2.2) 45 (3.8)<br />
Canada, British Columbia r 90 (2.3) r 92 (2.1) r 84 (3.2) r 68 (3.7) r 90 (2.3) r 82 (3.2) r 44 (4.4)<br />
Canada, Nova Scotia 89 (2.4) 94 (1.7) 86 (2.7) 79 (3.1) 90 (2.4) 86 (2.5) 48 (4.0)<br />
Canada, Ontario 84 (4.0) 89 (3.6) 76 (4.9) 70 (4.9) 88 (3.5) 82 (4.2) 53 (5.2)<br />
Canada, Quebec 74 (3.8) 82 (3.3) 54 (4.7) 41 (4.4) 58 (4.3) 55 (4.5) 39 (3.4)<br />
Chinese Taipei 87 (2.6) 61 (4.2) 67 (3.7) 53 (4.1) 42 (4.3) 66 (4.0) 55 (4.5)<br />
Denmark 79 (3.3) 80 (3.2) 68 (3.9) 51 (3.9) 43 (3.8) 52 (3.8) 39 (3.7)<br />
Engl<strong>and</strong> 92 (1.8) 97 (1.4) 71 (4.1) 63 (4.2) 87 (2.7) 89 (2.7) 74 (3.7)<br />
France 87 (2.0) 91 (1.9) 35 (3.6) 38 (2.8) 53 (3.9) 35 (3.4) 34 (3.4)<br />
Georgia 98 (0.9) 96 (1.9) 92 (2.4) 85 (3.1) 72 (3.9) 89 (2.6) 70 (3.9)<br />
Germany 95 (1.7) 94 (1.7) 75 (3.2) 49 (3.7) 55 (3.8) 69 (3.2) 26 (3.0)<br />
Hong Kong SAR 89 (2.5) 80 (3.3) 65 (4.0) 50 (4.2) 51 (4.5) 64 (4.6) 51 (4.4)<br />
Hungary 97 (1.9) 100 (0.0) 94 (2.2) 92 (2.2) 75 (3.6) 96 (1.7) 88 (2.7)<br />
Icel<strong>and</strong> 40 (0.3) 60 (0.4) 34 (0.4) 8 (0.3) 29 (0.3) 26 (0.3) 1 (0.0)<br />
Indonesia 86 (3.1) 87 (2.9) 56 (4.1) 49 (4.6) 36 (3.7) 57 (4.1) 44 (4.2)<br />
Iran, Islamic Rep. of 93 (1.8) 88 (2.2) 69 (3.8) 60 (4.0) 47 (3.7) 80 (3.3) 67 (3.3)<br />
Israel 99 (0.7) 99 (1.0) 82 (3.5) 70 (3.7) 84 (3.3) 93 (2.4) 88 (2.8)<br />
Italy 98 (1.0) 96 (1.4) 79 (3.1) 66 (3.4) 71 (3.5) 59 (3.7) 70 (3.5)<br />
Kuwait 85 (3.0) 90 (2.6) 60 (4.1) 55 (3.6) 47 (4.0) 67 (4.0) 51 (4.5)<br />
Latvia 97 (1.3) 98 (1.2) 92 (2.1) 65 (3.5) 70 (3.1) 89 (2.7) 35 (3.6)<br />
Lithuania 100 (0.0) 100 (0.4) 85 (2.5) 77 (3.2) 75 (3.0) 97 (1.3) 73 (3.3)<br />
Luxembourg 89 (0.1) 90 (0.1) 64 (0.2) 37 (0.2) 70 (0.2) 66 (0.2) 26 (0.1)<br />
Macedonia, Rep. of 99 (0.5) 100 (0.0) 90 (2.4) 82 (3.2) 74 (3.9) 94 (2.1) 76 (3.6)<br />
Moldova, Rep. of 100 (0.0) 100 (0.0) 95 (1.7) 87 (2.8) 83 (3.2) 99 (0.9) 89 (2.9)<br />
Morocco 95 (1.8) 93 (2.3) 55 (5.0) 47 (5.0) 58 (4.4) 63 (4.4) 59 (4.4)<br />
Netherl<strong>and</strong>s 84 (3.4) 87 (2.9) 65 (4.7) 34 (4.1) 50 (4.5) 66 (3.6) 34 (4.0)<br />
New Zeal<strong>and</strong> 95 (1.3) 94 (1.4) 82 (2.4) 60 (2.8) 94 (1.2) 87 (2.0) 65 (2.9)<br />
Norway 67 (4.4) 66 (4.6) 38 (4.3) 19 (3.8) 28 (3.7) 28 (4.4) 11 (2.3)<br />
Pol<strong>and</strong> 100 (0.2) 99 (0.6) 95 (1.9) 66 (3.7) 62 (4.1) 92 (2.1) 56 (4.2)<br />
Qatar s 100 (0.1) s 97 (0.1) s 86 (0.2) s 74 (0.2) s 69 (0.2) s 67 (0.2) s 72 (0.2)<br />
Romania 99 (0.6) 98 (1.2) 84 (2.5) 81 (3.0) 73 (3.4) 88 (2.7) 80 (3.3)<br />
Russian Federation 100 (0.5) 100 (0.3) 92 (2.0) 87 (2.0) 77 (3.2) 99 (0.9) 82 (2.7)<br />
Scotl<strong>and</strong> 93 (2.3) 95 (2.0) 71 (4.2) 55 (4.4) 85 (2.8) 79 (3.8) 68 (4.2)<br />
Singapore 95 (1.1) 95 (1.2) 80 (2.4) 70 (2.8) 84 (2.0) 83 (2.0) 64 (2.7)<br />
Slovak Republic 97 (0.9) 99 (0.6) 84 (2.5) 62 (3.3) 53 (3.8) 79 (2.8) 56 (3.6)<br />
Slovenia 85 (2.0) 95 (1.4) 84 (2.3) 52 (3.3) 46 (3.3) 74 (2.5) 55 (2.9)<br />
South Africa 79 (2.3) 79 (2.3) 66 (2.9) 65 (3.2) 64 (2.7) 54 (3.1) 46 (2.9)<br />
Spain 95 (1.7) 97 (1.4) 65 (4.1) 47 (4.4) 48 (4.2) 46 (4.0) 39 (4.1)<br />
Sweden 59 (4.0) 81 (2.9) 39 (3.8) 25 (3.5) 19 (3.4) 29 (3.8) 5 (1.6)<br />
Trinidad <strong>and</strong> Tobago 96 (1.9) 97 (1.5) 85 (2.6) 73 (3.7) 86 (3.0) 86 (2.9) 38 (3.6)<br />
United States 98 (1.0) 97 (1.0) 90 (2.1) 81 (3.2) 96 (1.4) 93 (1.6) 71 (3.2)<br />
International Avg. 90 (0.3) 91 (0.3) 72 (0.5) 58 (0.5) 61 (0.5) 71 (0.5) 53 (0.5)<br />
Background data provided by teachers.<br />
( ) St<strong>and</strong>ard errors appear in parentheses. Because results are rounded to the nearest<br />
whole number, some totals may appear inconsistent.<br />
An “r” indicates data are available for 70–84% of the students. An “s” indicates data are<br />
available for 50–69% of the students. An “x” indicates data are available for less than<br />
50% of the students.<br />
217<br />
<strong>PIRLS</strong> 2006<br />
4th Grade<br />
NOTE: The International Average does not include the results from the Canadian provinces.<br />
SOURCE: IEA Progress in International Reading Literacy Study (<strong>PIRLS</strong>) 2006


