

here - TIMSS and PIRLS Home - Boston College
here - TIMSS and PIRLS Home - Boston College
here - TIMSS and PIRLS Home - Boston College

You also want an ePaper? Increase the reach of your titles
YUMPU automatically turns print PDFs into web optimized ePapers that Google loves.
chapter 7: school contexts<br />
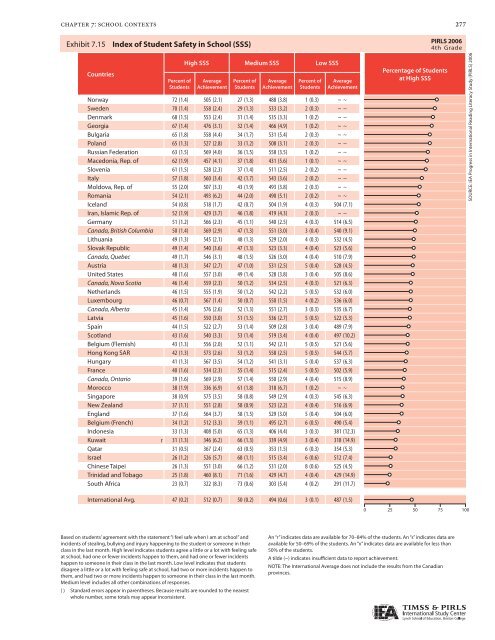
Exhibit Exhibit 7.15 7.15: Index Index of Student of Student Safety Safety in School in School (SSS) (SSS)<br />
Countries<br />
Percent of<br />
Students<br />
High SSS Medium SSS Low SSS<br />
Average<br />
Achievement<br />
Percent of<br />
Students<br />
Average<br />
Achievement<br />
Percent of<br />
Students<br />
Average<br />
Achievement<br />
Norway 72 (1.4) 505 (2.1) 27 (1.3) 488 (3.8) 1 (0.3) ~ ~<br />
Sweden 70 (1.4) 558 (2.4) 29 (1.3) 533 (3.2) 2 (0.3) ~ ~<br />
Denmark 68 (1.5) 553 (2.4) 31 (1.4) 535 (3.3) 1 (0.2) ~ ~<br />
Georgia 67 (1.4) 476 (3.1) 32 (1.4) 466 (4.9) 1 (0.2) ~ ~<br />
Bulgaria 65 (1.8) 558 (4.4) 34 (1.7) 531 (5.4) 2 (0.3) ~ ~<br />
Pol<strong>and</strong> 65 (1.3) 527 (2.8) 33 (1.2) 508 (3.1) 2 (0.3) ~ ~<br />
Russian Federation 63 (1.5) 569 (4.0) 36 (1.5) 558 (3.5) 1 (0.2) ~ ~<br />
Macedonia, Rep. of 62 (1.9) 457 (4.1) 37 (1.8) 431 (5.6) 1 (0.1) ~ ~<br />
Slovenia 61 (1.5) 528 (2.3) 37 (1.4) 511 (2.5) 2 (0.2) ~ ~<br />
Italy 57 (1.8) 560 (3.4) 42 (1.7) 543 (3.6) 2 (0.2) ~ ~<br />
Moldova, Rep. of 55 (2.0) 507 (3.3) 43 (1.9) 493 (3.8) 2 (0.3) ~ ~<br />
Romania 54 (2.1) 493 (6.2) 44 (2.0) 490 (5.1) 2 (0.2) ~ ~<br />
Icel<strong>and</strong> 54 (0.8) 518 (1.7) 42 (0.7) 504 (1.9) 4 (0.3) 504 (7.1)<br />
Iran, Islamic Rep. of 52 (1.9) 429 (3.7) 46 (1.8) 419 (4.3) 2 (0.3) ~ ~<br />
Germany 51 (1.2) 566 (2.3) 45 (1.1) 540 (2.5) 4 (0.3) 514 (6.5)<br />
Canada, British Columbia 50 (1.4) 569 (2.9) 47 (1.3) 551 (3.0) 3 (0.4) 540 (9.1)<br />
Lithuania 49 (1.3) 545 (2.1) 48 (1.3) 529 (2.0) 4 (0.3) 532 (4.5)<br />
Slovak Republic 49 (1.4) 540 (3.6) 47 (1.3) 523 (3.3) 4 (0.4) 523 (5.6)<br />
Canada, Quebec 49 (1.7) 546 (3.1) 48 (1.5) 526 (3.0) 4 (0.4) 510 (7.9)<br />
Austria 48 (1.3) 547 (2.7) 47 (1.0) 531 (2.5) 5 (0.4) 528 (4.5)<br />
United States 48 (1.6) 557 (3.0) 49 (1.4) 528 (3.8) 3 (0.4) 505 (8.6)<br />
Canada, Nova Scotia 46 (1.4) 559 (2.3) 50 (1.2) 534 (2.5) 4 (0.3) 521 (6.3)<br />
Netherl<strong>and</strong>s 46 (1.5) 555 (1.9) 50 (1.2) 542 (2.2) 5 (0.5) 532 (6.0)<br />
Luxembourg 46 (0.7) 567 (1.4) 50 (0.7) 550 (1.5) 4 (0.2) 536 (6.0)<br />
Canada, Alberta 45 (1.4) 576 (2.6) 52 (1.3) 551 (2.7) 3 (0.3) 535 (6.7)<br />
Latvia 45 (1.6) 550 (3.0) 51 (1.5) 536 (2.7) 5 (0.5) 522 (5.3)<br />
Spain 44 (1.5) 522 (2.7) 53 (1.4) 509 (2.8) 3 (0.4) 489 (7.9)<br />
Scotl<strong>and</strong> 43 (1.6) 540 (3.3) 53 (1.4) 519 (3.4) 4 (0.4) 497 (10.2)<br />
Belgium (Flemish) 43 (1.3) 556 (2.0) 52 (1.1) 542 (2.1) 5 (0.5) 521 (5.6)<br />
Hong Kong SAR 42 (1.3) 573 (2.6) 53 (1.2) 558 (2.5) 5 (0.5) 544 (5.7)<br />
Hungary 41 (1.3) 567 (3.5) 54 (1.2) 541 (3.1) 5 (0.4) 537 (6.3)<br />
France 40 (1.6) 534 (2.3) 55 (1.4) 515 (2.4) 5 (0.5) 502 (5.9)<br />
Canada, Ontario 39 (1.6) 569 (2.9) 57 (1.4) 550 (2.9) 4 (0.4) 515 (8.9)<br />
Morocco 38 (1.9) 336 (6.9) 61 (1.8) 318 (6.7) 1 (0.2) ~ ~<br />
Singapore 38 (0.9) 575 (3.5) 58 (0.8) 549 (2.9) 4 (0.3) 545 (6.3)<br />
New Zeal<strong>and</strong> 37 (1.1) 551 (2.8) 58 (0.9) 523 (2.2) 4 (0.4) 516 (6.9)<br />
Engl<strong>and</strong> 37 (1.6) 564 (3.7) 58 (1.5) 529 (3.0) 5 (0.4) 504 (6.0)<br />
Belgium (French) 34 (1.2) 512 (3.3) 59 (1.1) 495 (2.7) 6 (0.5) 490 (5.4)<br />
Indonesia 33 (1.3) 408 (5.0) 65 (1.3) 406 (4.4) 3 (0.3) 381 (12.3)<br />
Kuwait r 31 (1.3) 346 (6.2) 66 (1.3) 339 (4.9) 3 (0.4) 318 (14.9)<br />
Qatar 31 (0.5) 367 (2.4) 63 (0.5) 353 (1.5) 6 (0.3) 354 (5.3)<br />
Israel 26 (1.2) 526 (5.7) 68 (1.1) 515 (3.4) 6 (0.6) 512 (7.4)<br />
Chinese Taipei 26 (1.3) 551 (3.0) 66 (1.2) 531 (2.0) 8 (0.6) 525 (4.5)<br />
Trinidad <strong>and</strong> Tobago 25 (1.8) 460 (8.1) 71 (1.6) 429 (4.7) 4 (0.4) 429 (14.9)<br />
South Africa 23 (0.7) 322 (8.3) 73 (0.6) 303 (5.4) 4 (0.2) 291 (11.7)<br />
International Avg. 47 (0.2) 512 (0.7) 50 (0.2) 494 (0.6) 3 (0.1) 487 (1.5)<br />
Based on students’ agreement with the statement “I feel safe when I am at school” <strong>and</strong><br />
incidents of stealing, bullying <strong>and</strong> injury happening to the student or someone in their<br />
class in the last month. High level indicates students agree a little or a lot with feeling safe<br />
at school, had one or fewer incidents happen to them, <strong>and</strong> had one or fewer incidents<br />
happen to someone in their class in the last month. Low level indicates that students<br />
disagree a little or a lot with feeling safe at school, had two or more incidents happen to<br />
them, <strong>and</strong> had two or more incidents happen to someone in their class in the last month.<br />
Medium level includes all other combinations of responses.<br />
( ) St<strong>and</strong>ard errors appear in parentheses. Because results are rounded to the nearest<br />
whole number, some totals may appear inconsistent.<br />
Percentage of Students<br />
at High SSS<br />
An “r” indicates data are available for 70–84% of the students. An “s” indicates data are<br />
available for 50–69% of the students. An “x” indicates data are available for less than<br />
50% of the students.<br />
A tilde (~) indicates insufficient data to report achievement.<br />
NOTE: The International Average does not include the results from the Canadian<br />
provinces.<br />
277<br />
<strong>PIRLS</strong> 2006<br />
4th Grade<br />
0 25 50 75 100<br />
SOURCE: IEA Progress in International Reading Literacy Study (<strong>PIRLS</strong>) 2006


