

here - TIMSS and PIRLS Home - Boston College
here - TIMSS and PIRLS Home - Boston College
here - TIMSS and PIRLS Home - Boston College

You also want an ePaper? Increase the reach of your titles
YUMPU automatically turns print PDFs into web optimized ePapers that Google loves.
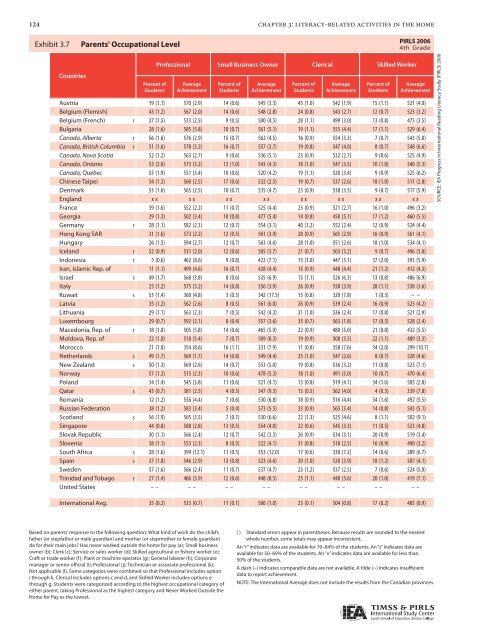
124 chapter 3: literacy-related activities in the home<br />
Exhibit Exhibit 3.7 3.7: Parents' Parents’ Occupational Level Level<br />
Countries<br />
Percent of<br />
Students<br />
Professional Small Business Owner Clerical Skilled Worker<br />
Average<br />
Achievement<br />
Percent of<br />
Students<br />
Average<br />
Achievement<br />
Percent of<br />
Students<br />
Average<br />
Achievement<br />
Percent of<br />
Students<br />
Average<br />
Achievement<br />
Austria 19 (1.1) 570 (2.9) 14 (0.6) 545 (3.3) 45 (1.0) 542 (1.9) 15 (1.1) 521 (4.0)<br />
Belgium (Flemish) 43 (1.2) 567 (2.0) 14 (0.6) 548 (2.8) 24 (0.8) 543 (2.7) 12 (0.7) 523 (3.2)<br />
Belgium (French) r 37 (1.5) 533 (2.5) 9 (0.5) 500 (4.5) 28 (1.1) 499 (3.0) 13 (0.8) 473 (3.5)<br />
Bulgaria 28 (1.6) 585 (5.8) 10 (0.7) 561 (5.1) 19 (1.1) 555 (4.4) 17 (1.1) 529 (6.4)<br />
Canada, Alberta r 56 (1.6) 576 (2.9) 15 (0.7) 562 (4.5) 16 (0.9) 554 (3.3) 7 (0.7) 543 (5.8)<br />
Canada, British Columbia r 51 (1.6) 578 (3.2) 16 (0.7) 557 (3.7) 19 (0.8) 547 (4.0) 8 (0.7) 548 (6.6)<br />
Canada, Nova Scotia 52 (1.2) 563 (2.7) 9 (0.6) 536 (5.1) 23 (0.9) 532 (2.7) 9 (0.6) 525 (4.9)<br />
Canada, Ontario 53 (2.0) 573 (3.2) 12 (1.0) 543 (4.3) 18 (1.0) 547 (3.5) 10 (1.0) 540 (5.3)<br />
Canada, Quebec 55 (1.9) 551 (3.4) 10 (0.6) 520 (4.2) 19 (1.1) 520 (3.4) 9 (0.9) 525 (6.2)<br />
Chinese Taipei 34 (1.3) 560 (2.5) 17 (0.6) 532 (2.5) 19 (0.7) 537 (2.6) 18 (1.0) 511 (2.8)<br />
Denmark 53 (1.6) 565 (2.5) 10 (0.7) 535 (4.7) 23 (0.9) 538 (3.5) 9 (0.7) 517 (5.9)<br />
Engl<strong>and</strong> x x x x x x x x x x x x x x x x<br />
France 39 (1.6) 552 (2.2) 11 (0.7) 525 (4.4) 23 (0.9) 521 (2.7) 16 (1.0) 496 (3.2)<br />
Georgia 29 (1.3) 502 (3.4) 10 (0.8) 477 (5.4) 14 (0.8) 458 (5.1) 17 (1.2) 460 (5.5)<br />
Germany r 28 (1.1) 582 (2.3) 12 (0.7) 554 (3.1) 40 (1.2) 552 (2.4) 12 (0.9) 524 (4.4)<br />
Hong Kong SAR 31 (1.6) 573 (2.2) 12 (0.5) 561 (3.9) 28 (0.9) 565 (2.9) 16 (0.9) 561 (4.1)<br />
Hungary 26 (1.5) 594 (2.7) 12 (0.7) 563 (4.6) 28 (1.0) 551 (2.6) 18 (1.0) 534 (4.1)<br />
Icel<strong>and</strong> r 52 (0.9) 531 (2.0) 12 (0.6) 505 (3.7) 21 (0.7) 503 (3.2) 9 (0.7) 496 (3.8)<br />
Indonesia r 5 (0.6) 462 (8.6) 9 (0.8) 422 (7.1) 13 (1.0) 447 (5.1) 37 (2.0) 393 (5.9)<br />
Iran, Islamic Rep. of 11 (1.1) 499 (4.6) 16 (0.7) 428 (4.4) 15 (0.9) 448 (4.4) 21 (1.2) 412 (4.3)<br />
Israel s 49 (1.7) 568 (3.8) 8 (0.6) 535 (6.9) 15 (1.1) 526 (6.3) 13 (0.8) 486 (6.9)<br />
Italy 25 (1.2) 575 (3.2) 14 (0.8) 556 (3.9) 26 (0.9) 558 (3.9) 28 (1.1) 538 (3.6)<br />
Kuwait s 53 (1.4) 360 (4.8) 3 (0.3) 342 (17.5) 15 (0.8) 320 (7.8) 1 (0.3) ~ ~<br />
Latvia 35 (1.2) 562 (2.6) 8 (0.5) 561 (6.0) 26 (0.9) 539 (2.4) 16 (0.9) 523 (4.2)<br />
Lithuania 29 (1.1) 563 (2.3) 7 (0.5) 542 (4.3) 31 (1.0) 536 (2.4) 17 (0.8) 521 (2.9)<br />
Luxembourg 29 (0.7) 592 (2.1) 8 (0.4) 557 (3.6) 35 (0.7) 563 (1.8) 17 (0.5) 528 (2.4)<br />
Macedonia, Rep. of r 18 (1.0) 505 (5.8) 14 (0.6) 465 (5.9) 22 (0.9) 480 (5.0) 21 (0.8) 432 (5.5)<br />
Moldova, Rep. of 22 (1.0) 518 (5.4) 7 (0.7) 509 (8.3) 19 (0.9) 508 (3.5) 22 (1.1) 489 (3.3)<br />
Morocco 21 (1.8) 354 (8.6) 16 (1.1) 331 (7.9) 11 (0.8) 358 (7.6) 34 (2.0) 299 (10.7)<br />
Netherl<strong>and</strong>s s 49 (1.7) 569 (1.7) 14 (0.8) 549 (4.4) 25 (1.0) 547 (2.6) 8 (0.7) 528 (4.6)<br />
New Zeal<strong>and</strong> s 50 (1.3) 569 (2.6) 14 (0.7) 553 (5.0) 19 (0.8) 536 (3.2) 11 (0.8) 523 (7.1)<br />
Norway 57 (1.3) 515 (2.3) 10 (0.6) 478 (5.3) 18 (1.0) 491 (5.0) 10 (0.7) 470 (6.4)<br />
Pol<strong>and</strong> 34 (1.4) 545 (3.8) 11 (0.6) 521 (4.1) 13 (0.8) 519 (4.1) 34 (1.6) 505 (2.8)<br />
Qatar s 43 (0.7) 381 (2.5) 4 (0.3) 347 (9.3) 13 (0.5) 362 (4.0) 4 (0.3) 339 (7.8)<br />
Romania 12 (1.2) 556 (4.4) 7 (0.6) 530 (6.8) 18 (0.9) 516 (4.4) 34 (1.6) 492 (5.5)<br />
Russian Federation 38 (1.2) 583 (3.4) 5 (0.4) 573 (5.5) 33 (0.9) 565 (3.4) 14 (0.8) 543 (5.1)<br />
Scotl<strong>and</strong> s 56 (1.9) 565 (3.5) 7 (0.7) 530 (6.6) 22 (1.3) 525 (4.6) 8 (1.1) 502 (9.1)<br />
Singapore 44 (0.8) 588 (2.8) 13 (0.5) 554 (4.0) 22 (0.6) 545 (3.3) 11 (0.5) 523 (4.8)<br />
Slovak Republic 30 (1.1) 566 (2.4) 12 (0.7) 542 (3.3) 26 (0.9) 534 (3.1) 20 (0.9) 519 (3.4)<br />
Slovenia 38 (1.1) 553 (2.3) 8 (0.5) 522 (4.1) 31 (0.8) 518 (2.5) 16 (0.9) 490 (3.2)<br />
South Africa s 28 (1.6) 399 (12.1) 11 (0.5) 353 (12.0) 17 (0.6) 330 (7.2) 14 (0.6) 289 (6.7)<br />
Spain s 37 (1.8) 546 (2.9) 13 (0.8) 523 (4.6) 20 (1.0) 520 (3.9) 18 (1.2) 507 (4.1)<br />
Sweden 57 (1.6) 566 (2.4) 11 (0.7) 537 (4.7) 23 (1.2) 537 (2.5) 7 (0.6) 524 (5.0)<br />
Trinidad <strong>and</strong> Tobago r 27 (1.4) 486 (5.9) 12 (0.6) 448 (8.5) 25 (1.1) 448 (5.6) 20 (1.0) 419 (7.1)<br />
United States – – – – – – – – – – – – – – – –<br />
International Avg. 35 (0.2) 533 (0.7) 11 (0.1) 506 (1.0) 23 (0.1) 504 (0.8) 17 (0.2) 485 (0.9)<br />
Based on parents’ response to the following question: What kind of work do the child’s<br />
father (or stepfather or male guardian) <strong>and</strong> mother (or stepmother or female guardian)<br />
do for their main jobs? Has never worked outside the home for pay (a); Small business<br />
owner (b); Clerk (c); Service or sales worker (d); Skilled agricultural or fishery worker (e);<br />
Craft or trade worker (f ); Plant or machine operator (g); General laborer (h); Corporate<br />
manager or senior official (i); Professional (j); Technician or associate professional (k);<br />
Not applicable (l). Some categories were combined so that Professional includes option<br />
i through k, Clerical includes options c <strong>and</strong> d, <strong>and</strong> Skilled Worker includes options e<br />
through g. Students were categorized according to the highest occupational category of<br />
either parent, taking Professional as the highest category <strong>and</strong> Never Worked Outside the<br />
<strong>Home</strong> for Pay as the lowest.<br />
<strong>PIRLS</strong> 2006<br />
4th Grade<br />
( ) St<strong>and</strong>ard errors appear in parentheses. Because results are rounded to the nearest<br />
whole number, some totals may appear inconsistent.<br />
An “r” indicates data are available for 70–84% of the students. An “s” indicates data are<br />
available for 50–69% of the students. An “x” indicates data are available for less than<br />
50% of the students.<br />
A dash (–) indicates comparable data are not available. A tilde (~) indicates insufficient<br />
data to report achievement.<br />
NOTE: The International Average does not include the results from the Canadian provinces.<br />
SOURCE: IEA Progress in International Reading Literacy Study (<strong>PIRLS</strong>) 2006


