

here - TIMSS and PIRLS Home - Boston College
here - TIMSS and PIRLS Home - Boston College
here - TIMSS and PIRLS Home - Boston College

You also want an ePaper? Increase the reach of your titles
YUMPU automatically turns print PDFs into web optimized ePapers that Google loves.
chapter 6: teachers <strong>and</strong> reading instruction<br />
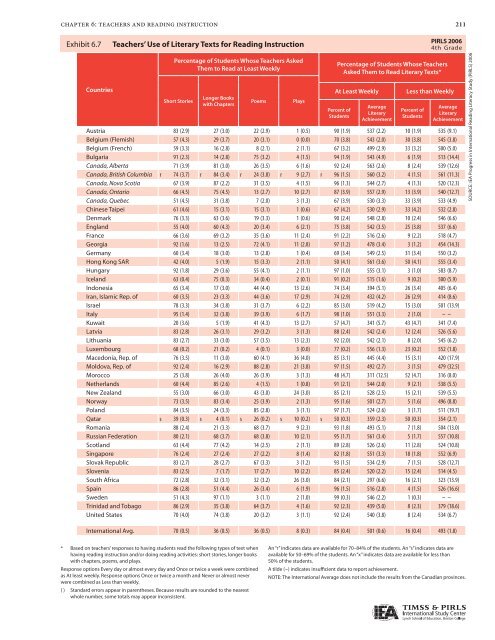
Exhibit Exhibit 6.7 6.7: Teachers’ Use Use of of Literary Texts for for Reading Instruction<br />
Countries<br />
Percentage of Students Whose Teachers Asked<br />
Them to Read at Least Weekly<br />
Short Stories<br />
Longer Books<br />
with Chapters<br />
Poems Plays<br />
Percentage of Students Whose Teachers<br />
Asked Them to Read Literary Texts*<br />
At Least Weekly Less than Weekly<br />
Percent of<br />
Students<br />
Average<br />
Literary<br />
Achievement<br />
Percent of<br />
Students<br />
211<br />
Average<br />
Literary<br />
Achievement<br />
Austria 83 (2.9) 27 (3.0) 22 (2.9) 1 (0.5) 90 (1.9) 537 (2.2) 10 (1.9) 535 (9.1)<br />
Belgium (Flemish) 57 (4.3) 29 (3.7) 20 (3.1) 0 (0.0) 70 (3.8) 543 (2.0) 30 (3.8) 545 (3.8)<br />
Belgium (French) 59 (3.3) 16 (2.8) 8 (2.1) 2 (1.1) 67 (3.2) 499 (2.9) 33 (3.2) 500 (5.0)<br />
Bulgaria 91 (2.3) 14 (2.8) 75 (3.2) 4 (1.5) 94 (1.9) 543 (4.9) 6 (1.9) 513 (14.4)<br />
Canada, Alberta 71 (3.9) 81 (3.0) 26 (3.5) 6 (1.6) 92 (2.4) 563 (2.6) 8 (2.4) 539 (12.6)<br />
Canada, British Columbia r 74 (3.7) r 84 (3.4) r 24 (3.8) r 9 (2.7) r 96 (1.5) 560 (3.2) 4 (1.5) 561 (11.3)<br />
Canada, Nova Scotia 67 (3.9) 87 (2.2) 31 (3.5) 4 (1.5) 96 (1.3) 544 (2.7) 4 (1.3) 520 (12.3)<br />
Canada, Ontario 66 (4.5) 75 (4.5) 13 (2.7) 10 (2.7) 87 (3.9) 557 (2.9) 13 (3.9) 540 (12.7)<br />
Canada, Quebec 51 (4.5) 31 (3.8) 7 (2.0) 3 (1.3) 67 (3.9) 530 (3.3) 33 (3.9) 533 (4.9)<br />
Chinese Taipei 61 (4.6) 15 (3.1) 15 (3.1) 1 (0.6) 67 (4.2) 530 (2.9) 33 (4.2) 532 (2.8)<br />
Denmark 76 (3.3) 63 (3.6) 19 (3.3) 1 (0.6) 90 (2.4) 548 (2.8) 10 (2.4) 546 (6.6)<br />
Engl<strong>and</strong> 55 (4.0) 60 (4.3) 20 (3.4) 6 (2.1) 75 (3.8) 542 (3.5) 25 (3.8) 537 (6.6)<br />
France 66 (3.6) 69 (3.2) 35 (3.6) 11 (2.4) 91 (2.2) 516 (2.6) 9 (2.2) 518 (4.7)<br />
Georgia 92 (1.6) 13 (2.5) 72 (4.1) 11 (2.8) 97 (1.2) 478 (3.4) 3 (1.2) 454 (14.3)<br />
Germany 60 (3.4) 18 (3.0) 13 (2.8) 1 (0.4) 69 (3.4) 549 (2.5) 31 (3.4) 550 (3.2)<br />
Hong Kong SAR 42 (4.0) 5 (1.9) 15 (3.3) 2 (1.1) 50 (4.1) 561 (3.6) 50 (4.1) 555 (3.4)<br />
Hungary 92 (1.8) 29 (3.6) 55 (4.1) 2 (1.1) 97 (1.0) 555 (3.1) 3 (1.0) 583 (8.7)<br />
Icel<strong>and</strong> 63 (0.4) 75 (0.3) 34 (0.4) 2 (0.1) 91 (0.2) 515 (1.6) 9 (0.2) 500 (5.9)<br />
Indonesia 65 (3.4) 17 (3.0) 44 (4.4) 13 (2.6) 74 (3.4) 394 (5.1) 26 (3.4) 405 (6.4)<br />
Iran, Islamic Rep. of 60 (3.5) 23 (3.3) 44 (3.6) 17 (2.9) 74 (2.9) 432 (4.2) 26 (2.9) 414 (8.6)<br />
Israel 78 (3.3) 34 (3.8) 31 (3.7) 6 (2.2) 85 (3.0) 519 (4.2) 15 (3.0) 501 (13.9)<br />
Italy 95 (1.4) 32 (3.8) 39 (3.9) 6 (1.7) 98 (1.0) 551 (3.3) 2 (1.0) ~ ~<br />
Kuwait 20 (3.6) 5 (1.9) 41 (4.3) 13 (2.7) 57 (4.7) 341 (5.7) 43 (4.7) 341 (7.4)<br />
Latvia 83 (2.8) 26 (3.1) 29 (3.2) 3 (1.3) 88 (2.4) 542 (2.4) 12 (2.4) 526 (5.6)<br />
Lithuania 83 (2.7) 33 (3.0) 57 (3.5) 13 (2.3) 92 (2.0) 542 (2.1) 8 (2.0) 545 (6.2)<br />
Luxembourg 68 (0.2) 21 (0.2) 4 (0.1) 3 (0.0) 77 (0.2) 556 (1.3) 23 (0.2) 552 (1.8)<br />
Macedonia, Rep. of 76 (3.5) 11 (3.0) 60 (4.1) 36 (4.0) 85 (3.1) 445 (4.4) 15 (3.1) 420 (17.9)<br />
Moldova, Rep. of 92 (2.4) 16 (2.9) 88 (2.8) 21 (3.8) 97 (1.5) 492 (2.7) 3 (1.5) 479 (32.5)<br />
Morocco 25 (3.8) 26 (4.0) 26 (3.9) 3 (1.3) 48 (4.7) 311 (12.5) 52 (4.7) 316 (8.0)<br />
Netherl<strong>and</strong>s 60 (4.4) 85 (2.6) 4 (1.5) 1 (0.8) 91 (2.1) 544 (2.0) 9 (2.1) 538 (5.5)<br />
New Zeal<strong>and</strong> 55 (3.0) 66 (3.0) 43 (3.0) 24 (3.0) 85 (2.1) 528 (2.5) 15 (2.1) 539 (5.5)<br />
Norway 73 (3.5) 83 (3.4) 25 (3.9) 2 (1.3) 95 (1.6) 501 (2.7) 5 (1.6) 496 (8.8)<br />
Pol<strong>and</strong> 84 (3.5) 24 (3.3) 85 (2.8) 3 (1.1) 97 (1.7) 524 (2.6) 3 (1.7) 511 (19.7)<br />
Qatar s 39 (0.3) s 4 (0.1) s 26 (0.2) s 10 (0.2) s 50 (0.3) 359 (2.3) 50 (0.3) 354 (2.1)<br />
Romania 88 (2.4) 21 (3.3) 68 (3.7) 9 (2.3) 93 (1.8) 493 (5.1) 7 (1.8) 504 (13.0)<br />
Russian Federation 80 (2.1) 68 (3.7) 68 (3.8) 10 (2.1) 95 (1.7) 561 (3.4) 5 (1.7) 557 (10.8)<br />
Scotl<strong>and</strong> 63 (4.4) 77 (4.2) 14 (2.5) 2 (1.1) 89 (2.8) 526 (2.6) 11 (2.8) 524 (10.8)<br />
Singapore 76 (2.4) 27 (2.4) 27 (2.2) 8 (1.4) 82 (1.8) 551 (3.3) 18 (1.8) 552 (6.9)<br />
Slovak Republic 83 (2.7) 28 (2.7) 67 (3.3) 3 (1.2) 93 (1.5) 534 (2.9) 7 (1.5) 528 (12.7)<br />
Slovenia 83 (2.5) 7 (1.7) 17 (2.7) 10 (2.2) 85 (2.4) 520 (2.2) 15 (2.4) 514 (4.5)<br />
South Africa 72 (2.8) 32 (3.1) 32 (3.2) 26 (3.0) 84 (2.1) 297 (6.6) 16 (2.1) 323 (13.9)<br />
Spain 86 (2.8) 51 (4.4) 26 (3.4) 6 (1.9) 96 (1.5) 516 (2.8) 4 (1.5) 526 (16.6)<br />
Sweden 51 (4.3) 97 (1.1) 3 (1.1) 2 (1.0) 99 (0.3) 546 (2.2) 1 (0.3) ~ ~<br />
Trinidad <strong>and</strong> Tobago 86 (2.9) 35 (3.8) 64 (3.7) 4 (1.6) 92 (2.3) 439 (5.0) 8 (2.3) 379 (18.6)<br />
United States 70 (4.0) 74 (3.8) 20 (3.2) 3 (1.1) 92 (2.4) 540 (3.8) 8 (2.4) 534 (6.7)<br />
International Avg. 70 (0.5) 36 (0.5) 36 (0.5) 8 (0.3) 84 (0.4) 501 (0.6) 16 (0.4) 493 (1.8)<br />
* Based on teachers’ responses to having students read the following types of text when<br />
having reading instruction <strong>and</strong>/or doing reading activities: short stories, longer books<br />
with chapters, poems, <strong>and</strong> plays.<br />
Response options Every day or almost every day <strong>and</strong> Once or twice a week were combined<br />
as At least weekly. Response options Once or twice a month <strong>and</strong> Never or almost never<br />
were combined as Less than weekly.<br />
( ) St<strong>and</strong>ard errors appear in parentheses. Because results are rounded to the nearest<br />
whole number, some totals may appear inconsistent.<br />
An “r” indicates data are available for 70–84% of the students. An “s” indicates data are<br />
available for 50–69% of the students. An “x” indicates data are available for less than<br />
50% of the students.<br />
A tilde (~) indicates insufficient data to report achievement.<br />
<strong>PIRLS</strong> 2006<br />
4th Grade<br />
NOTE: The International Average does not include the results from the Canadian provinces.<br />
SOURCE: IEA Progress in International Reading Literacy Study (<strong>PIRLS</strong>) 2006


