

here - TIMSS and PIRLS Home - Boston College
here - TIMSS and PIRLS Home - Boston College
here - TIMSS and PIRLS Home - Boston College

Create successful ePaper yourself
Turn your PDF publications into a flip-book with our unique Google optimized e-Paper software.
264 chapter 7: school contexts<br />
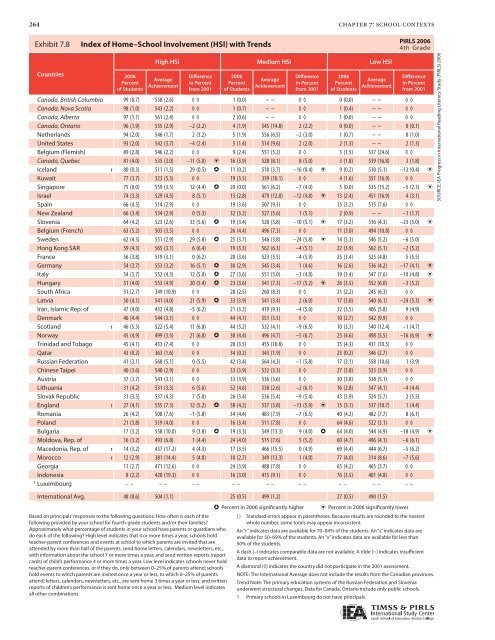
Exhibit 7.8: 7.8 Index Index of of <strong>Home</strong>–School Involvement (HSI) (HSI) with with Trends<br />
Countries<br />
2006<br />
Percent<br />
of Students<br />
High HSI Medium HSI Low HSI<br />
Average<br />
Achievement<br />
Difference<br />
in Percent<br />
from 2001<br />
2006<br />
Percent<br />
of Students<br />
Average<br />
Achievement<br />
Difference<br />
in Percent<br />
from 2001<br />
2006<br />
Percent<br />
of Students<br />
Average<br />
Achievement<br />
Difference<br />
in Percent<br />
from 2001<br />
Canada, British Columbia 99 (0.7) 558 (2.6) ◊ ◊ 1 (0.0) ~ ~ ◊ ◊ 0 (0.0) ~ ~ ◊ ◊<br />
Canada, Nova Scotia 98 (1.0) 543 (2.2) ◊ ◊ 1 (0.7) ~ ~ ◊ ◊ 1 (0.4) ~ ~ ◊ ◊<br />
Canada, Alberta 97 (1.1) 561 (2.4) ◊ ◊ 2 (0.6) ~ ~ ◊ ◊ 1 (0.0) ~ ~ ◊ ◊<br />
Canada, Ontario 96 (1.9) 555 (2.9) –2 (2.2) 4 (1.9) 545 (14.8) 2 (2.2) 0 (0.0) ~ ~ 0 (0.1)<br />
Netherl<strong>and</strong>s 94 (2.0) 546 (1.7) 2 (3.2) 5 (1.9) 556 (6.5) –2 (3.0) 1 (0.7) ~ ~ 0 (1.0)<br />
United States 93 (2.0) 542 (3.7) –4 (2.4) 5 (1.4) 514 (9.6) 2 (2.0) 2 (1.3) ~ ~ 2 (1.3)<br />
Belgium (Flemish) 89 (2.8) 546 (2.2) ◊ ◊ 9 (2.4) 551 (5.2) ◊ ◊ 3 (1.5) 537 (24.6) ◊ ◊<br />
Canada, Quebec 81 (4.0) 535 (3.0) –11 (5.0) i 16 (3.9) 528 (8.1) 8 (5.0) 3 (1.8) 519 (16.8) 3 (1.8)<br />
Icel<strong>and</strong> r 80 (0.3) 511 (1.5) 29 (0.5) h 11 (0.2) 510 (3.7) –16 (0.4) i 9 (0.2) 510 (5.1) –13 (0.4) i<br />
Kuwait 77 (3.7) 323 (5.3) ◊ ◊ 19 (3.5) 339 (10.1) ◊ ◊ 4 (1.6) 351 (16.9) ◊ ◊<br />
Singapore 75 (0.0) 559 (3.5) 12 (4.4) h 20 (0.0) 561 (6.2) –7 (4.0) 5 (0.0) 535 (15.2) –5 (2.3) i<br />
Israel 74 (3.3) 529 (4.5) 8 (5.1) 13 (2.8) 479 (12.8) –12 (4.8) i 13 (2.4) 451 (16.9) 4 (3.1)<br />
Spain 66 (4.5) 514 (2.9) ◊ ◊ 19 (3.6) 507 (9.1) ◊ ◊ 15 (3.2) 515 (7.6) ◊ ◊<br />
New Zeal<strong>and</strong> 66 (3.4) 534 (2.9) 0 (5.3) 32 (3.2) 527 (5.6) 1 (5.1) 2 (0.9) ~ ~ –1 (1.7)<br />
Slovenia 64 (4.2) 523 (2.6) 33 (5.6) h 19 (3.4) 520 (5.8) –10 (5.1) i 17 (3.2) 516 (4.3) –23 (5.0) i<br />
Belgium (French) 63 (5.2) 503 (3.5) ◊ ◊ 26 (4.4) 496 (7.3) ◊ ◊ 11 (3.0) 494 (10.8) ◊ ◊<br />
Sweden 62 (4.3) 551 (2.9) 29 (5.8) h 25 (3.7) 546 (3.8) –24 (5.8) i 14 (3.3) 546 (5.2) –6 (5.0)<br />
Hong Kong SAR 59 (4.3) 565 (3.1) 6 (6.4) 19 (3.3) 562 (6.3) –4 (5.1) 22 (3.9) 562 (5.1) –2 (5.2)<br />
France 56 (3.8) 519 (3.1) 0 (6.2) 20 (3.6) 523 (5.5) –4 (5.9) 25 (3.4) 525 (4.8) 5 (5.5)<br />
Germany 54 (3.7) 553 (3.2) 16 (5.1) h 30 (2.9) 545 (3.4) 1 (4.6) 16 (2.6) 536 (4.2) –17 (4.1) i<br />
Italy 54 (3.7) 552 (4.3) 12 (5.0) h 27 (3.6) 551 (5.0) –3 (4.8) 19 (3.4) 547 (7.6) –10 (4.8) i<br />
Hungary 51 (4.0) 553 (4.9) 20 (5.4) h 23 (3.6) 541 (7.3) –17 (5.2) i 26 (3.5) 552 (6.0) –3 (5.2)<br />
South Africa 51 (2.7) 349 (10.9) ◊ ◊ 28 (2.5) 260 (8.3) ◊ ◊ 21 (2.2) 245 (6.3) ◊ ◊<br />
Latvia 50 (4.1) 541 (4.0) 21 (5.9) h 33 (3.9) 541 (3.4) 2 (6.0) 17 (3.0) 540 (6.1) –24 (5.3) i<br />
Iran, Islamic Rep. of 47 (4.0) 432 (4.8) –5 (6.2) 21 (3.2) 419 (9.3) –4 (5.0) 32 (3.5) 406 (5.8) 9 (4.9)<br />
Denmark 46 (4.4) 544 (3.1) ◊ ◊ 44 (4.1) 551 (3.5) ◊ ◊ 10 (2.7) 542 (9.9) ◊ ◊<br />
Scotl<strong>and</strong> r 46 (5.3) 522 (5.4) 11 (6.8) 44 (5.2) 532 (4.1) –9 (6.5) 10 (3.3) 540 (12.4) –1 (4.7)<br />
Norway 45 (4.9) 499 (3.5) 21 (6.8) h 30 (4.4) 496 (4.7) –5 (6.7) 25 (4.6) 498 (5.5) –16 (6.9) i<br />
Trinidad <strong>and</strong> Tobago 45 (4.1) 433 (7.4) ◊ ◊ 20 (3.5) 455 (10.8) ◊ ◊ 35 (4.3) 431 (10.5) ◊ ◊<br />
Qatar 43 (0.2) 363 (1.6) ◊ ◊ 34 (0.2) 343 (1.9) ◊ ◊ 23 (0.2) 346 (2.7) ◊ ◊<br />
Russian Federation 41 (3.1) 568 (5.1) 0 (5.5) 42 (3.4) 564 (4.3) –1 (5.8) 17 (3.1) 558 (10.6) 1 (3.9)<br />
Chinese Taipei 40 (3.6) 540 (2.9) ◊ ◊ 33 (3.9) 532 (3.3) ◊ ◊ 27 (3.8) 533 (3.9) ◊ ◊<br />
Austria 37 (3.7) 541 (3.1) ◊ ◊ 33 (3.9) 536 (3.6) ◊ ◊ 30 (3.8) 538 (5.1) ◊ ◊<br />
Lithuania 31 (4.2) 531 (3.3) 6 (5.6) 52 (4.6) 538 (2.6) –2 (6.1) 16 (2.8) 547 (4.1) –4 (4.4)<br />
Slovak Republic 31 (3.5) 537 (4.3) 7 (5.0) 26 (3.4) 536 (5.4) –9 (5.4) 43 (3.9) 524 (5.7) 2 (5.5)<br />
Engl<strong>and</strong> r 27 (4.1) 555 (7.3) 12 (5.2) h 58 (4.2) 537 (3.8) –13 (5.9) i 15 (3.1) 537 (10.7) 1 (4.4)<br />
Romania 26 (4.2) 508 (7.6) –1 (5.8) 34 (4.4) 483 (7.9) –7 (6.5) 40 (4.2) 482 (7.7) 8 (6.1)<br />
Pol<strong>and</strong> 21 (3.8) 519 (4.0) ◊ ◊ 16 (3.4) 511 (7.8) ◊ ◊ 64 (4.6) 522 (3.1) ◊ ◊<br />
Bulgaria 17 (3.2) 558 (10.0) 9 (3.8) h 19 (3.3) 549 (13.3) 9 (4.0) h 64 (4.0) 544 (4.9) –18 (4.9) i<br />
Moldova, Rep. of 16 (3.2) 493 (6.8) 1 (4.4) 24 (4.0) 515 (7.6) 5 (5.2) 60 (4.7) 496 (4.1) –6 (6.1)<br />
Macedonia, Rep. of r 14 (3.2) 437 (17.2) 4 (4.3) 17 (3.5) 466 (15.5) 0 (4.9) 69 (4.4) 444 (6.7) –5 (6.2)<br />
Morocco r 12 (2.9) 381 (14.4) 5 (4.0) 10 (2.7) 349 (13.3) 1 (4.0) 77 (4.0) 314 (8.6) –7 (5.6)<br />
Georgia 11 (2.7) 471 (12.6) ◊ ◊ 24 (3.9) 488 (7.8) ◊ ◊ 65 (4.2) 465 (3.7) ◊ ◊<br />
Indonesia 8 (2.2) 420 (19.3) ◊ ◊ 16 (3.0) 415 (9.1) ◊ ◊ 76 (3.5) 401 (4.8) ◊ ◊<br />
1 Luxembourg – – – – – – – – – – – – – – – – – –<br />
International Avg. 48 (0.6) 504 (1.1) 25 (0.5) 499 (1.2) 27 (0.5) 490 (1.5)<br />
Based on principals’ responses to the following questions: How often is each of the<br />
following provided by your school for fourth-grade students <strong>and</strong>/or their families?<br />
Approximately what percentage of students in your school have parents or guardians who<br />
do each of the following? High level indicates that 4 or more times a year, schools hold<br />
teacher-parent conferences <strong>and</strong> events at school to which parents are invited that are<br />
attended by more than half of the parents, send home letters, calendars, newsletters, etc.,<br />
with information about the school 7 or more times a year, <strong>and</strong> send written reports (report<br />
cards) of child’s performance 4 or more times a year. Low level indicates schools never hold<br />
teacher-parent conferences, or if they do, only between 0–25% of parents attend; schools<br />
hold events to which parents are invited once a year or less, to which 0–25% of parents<br />
attend; letters, calendars, newsletters, etc., are sent home 3 times a year or less; <strong>and</strong> written<br />
reports of children’s performance is sent home once a year or less. Medium level indicates<br />
all other combinations.<br />
h Percent in 2006 significantly higher i Percent in 2006 significantly lower<br />
( ) St<strong>and</strong>ard errors appear in parentheses. Because results are rounded to the nearest<br />
whole number, some totals may appear inconsistent.<br />
An “r” indicates data are available for 70–84% of the students. An “s” indicates data are<br />
available for 50–69% of the students. An “x” indicates data are available for less than<br />
50% of the students.<br />
A dash (–) indicates comparable data are not available. A tilde (~) indicates insufficient<br />
data to report achievement.<br />
A diamond (◊) indicates the country did not participate in the 2001 assessment.<br />
NOTE: The International Average does not include the results from the Canadian provinces.<br />
Trend Note: The primary education systems of the Russian Federation <strong>and</strong> Slovenia<br />
underwent structural changes. Data for Canada, Ontario include only public schools.<br />
1 Primary schools in Luxembourg do not have principals.<br />
<strong>PIRLS</strong> 2006<br />
4th Grade<br />
SOURCE: IEA Progress in International Reading Literacy Study (<strong>PIRLS</strong>) 2006


