

here - TIMSS and PIRLS Home - Boston College
here - TIMSS and PIRLS Home - Boston College
here - TIMSS and PIRLS Home - Boston College

You also want an ePaper? Increase the reach of your titles
YUMPU automatically turns print PDFs into web optimized ePapers that Google loves.
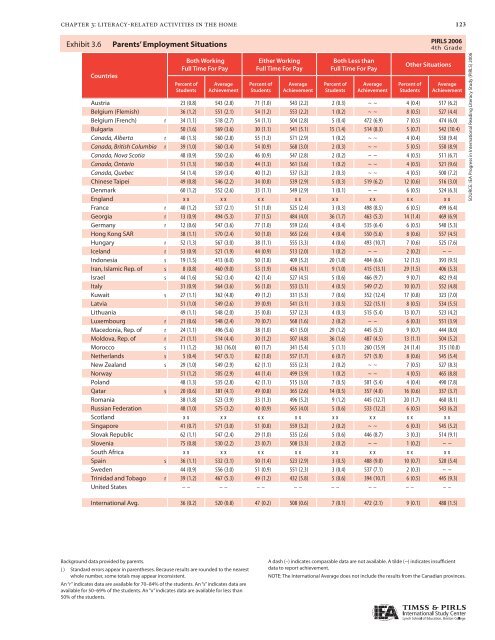
chapter 3: literacy-related activities in the home<br />
Exhibit Exhibit 3.6 3.6: Parents’ Employment Situations<br />
Countries<br />
Both Working<br />
Full Time For Pay<br />
Percent of<br />
Students<br />
Average<br />
Achievement<br />
Either Working<br />
Full Time For Pay<br />
Percent of<br />
Students<br />
Average<br />
Achievement<br />
Both Less than<br />
Full Time For Pay<br />
Percent of<br />
Students<br />
Average<br />
Achievement<br />
Other Situations<br />
Percent of<br />
Students<br />
123<br />
Average<br />
Achievement<br />
Austria 23 (0.8) 543 (2.8) 71 (1.0) 543 (2.2) 2 (0.3) ~ ~ 4 (0.4) 517 (6.2)<br />
Belgium (Flemish) 36 (1.2) 551 (2.1) 54 (1.2) 553 (2.2) 1 (0.2) ~ ~ 8 (0.5) 527 (4.4)<br />
Belgium (French) r 34 (1.1) 518 (2.7) 54 (1.1) 504 (2.8) 5 (0.4) 472 (6.9) 7 (0.5) 474 (6.0)<br />
Bulgaria 50 (1.6) 569 (3.6) 30 (1.1) 541 (5.1) 15 (1.4) 514 (8.3) 5 (0.7) 542 (10.4)<br />
Canada, Alberta r 40 (1.3) 560 (2.8) 55 (1.3) 571 (2.9) 1 (0.2) ~ ~ 4 (0.4) 550 (9.4)<br />
Canada, British Columbia r 39 (1.0) 560 (3.4) 54 (0.9) 568 (3.0) 2 (0.3) ~ ~ 5 (0.5) 550 (8.9)<br />
Canada, Nova Scotia 48 (0.9) 550 (2.6) 46 (0.9) 547 (2.8) 2 (0.2) ~ ~ 4 (0.5) 511 (6.7)<br />
Canada, Ontario 51 (1.3) 560 (3.0) 44 (1.3) 561 (3.6) 1 (0.2) ~ ~ 4 (0.5) 521 (9.6)<br />
Canada, Quebec 54 (1.4) 539 (3.4) 40 (1.2) 537 (3.2) 2 (0.3) ~ ~ 4 (0.5) 500 (7.2)<br />
Chinese Taipei 49 (0.8) 546 (2.2) 34 (0.8) 539 (2.9) 5 (0.3) 519 (6.2) 12 (0.6) 516 (3.0)<br />
Denmark 60 (1.2) 552 (2.6) 33 (1.1) 549 (2.9) 1 (0.1) ~ ~ 6 (0.5) 524 (6.3)<br />
Engl<strong>and</strong> x x x x x x x x x x x x x x x x<br />
France r 40 (1.2) 537 (2.1) 51 (1.0) 525 (2.4) 3 (0.3) 498 (8.5) 6 (0.5) 499 (6.4)<br />
Georgia r 13 (0.9) 494 (5.3) 37 (1.5) 484 (4.0) 36 (1.7) 463 (5.3) 14 (1.4) 469 (6.9)<br />
Germany r 12 (0.6) 547 (3.6) 77 (1.0) 559 (2.6) 4 (0.4) 535 (6.4) 6 (0.5) 540 (5.3)<br />
Hong Kong SAR 38 (1.1) 570 (2.4) 50 (1.0) 565 (2.6) 4 (0.4) 550 (5.6) 8 (0.6) 557 (4.5)<br />
Hungary r 52 (1.3) 567 (3.0) 38 (1.1) 555 (3.3) 4 (0.6) 493 (10.7) 7 (0.6) 525 (7.6)<br />
Icel<strong>and</strong> r 53 (0.9) 521 (1.9) 44 (0.9) 513 (2.0) 1 (0.2) ~ ~ 2 (0.2) ~ ~<br />
Indonesia s 19 (1.5) 413 (6.0) 50 (1.8) 409 (5.2) 20 (1.8) 404 (6.6) 12 (1.5) 393 (9.5)<br />
Iran, Islamic Rep. of s 8 (0.8) 460 (9.0) 53 (1.9) 436 (4.1) 9 (1.0) 415 (13.1) 29 (1.5) 406 (5.3)<br />
Israel s 44 (1.6) 562 (3.4) 42 (1.4) 527 (4.5) 5 (0.6) 466 (9.7) 9 (0.7) 482 (9.4)<br />
Italy 31 (0.9) 564 (3.6) 56 (1.0) 553 (3.1) 4 (0.5) 549 (7.2) 10 (0.7) 552 (4.8)<br />
Kuwait s 27 (1.1) 362 (4.8) 49 (1.2) 331 (5.3) 7 (0.6) 352 (12.4) 17 (0.8) 323 (7.0)<br />
Latvia 51 (1.0) 549 (2.6) 39 (0.9) 541 (3.1) 3 (0.5) 522 (15.1) 8 (0.5) 534 (5.5)<br />
Lithuania 49 (1.1) 548 (2.0) 35 (0.8) 537 (2.3) 4 (0.3) 515 (5.4) 13 (0.7) 523 (4.2)<br />
Luxembourg r 21 (0.6) 548 (2.4) 70 (0.7) 568 (1.6) 2 (0.2) ~ ~ 6 (0.3) 551 (3.9)<br />
Macedonia, Rep. of r 24 (1.1) 496 (5.6) 38 (1.0) 451 (5.0) 29 (1.2) 445 (5.3) 9 (0.7) 444 (8.0)<br />
Moldova, Rep. of r 21 (1.1) 514 (4.4) 30 (1.2) 507 (4.8) 36 (1.6) 487 (4.5) 13 (1.1) 504 (5.2)<br />
Morocco s 11 (1.2) 363 (16.0) 60 (1.7) 341 (5.4) 5 (1.1) 260 (15.9) 24 (1.4) 315 (10.0)<br />
Netherl<strong>and</strong>s s 5 (0.4) 547 (5.1) 82 (1.0) 557 (1.7) 6 (0.7) 571 (5.9) 8 (0.6) 545 (5.4)<br />
New Zeal<strong>and</strong> s 29 (1.0) 549 (2.9) 62 (1.1) 555 (2.3) 2 (0.2) ~ ~ 7 (0.5) 527 (8.3)<br />
Norway 51 (1.2) 505 (2.9) 44 (1.4) 499 (3.9) 1 (0.2) ~ ~ 4 (0.5) 465 (8.8)<br />
Pol<strong>and</strong> 48 (1.3) 535 (2.8) 42 (1.1) 515 (3.0) 7 (0.5) 501 (5.4) 4 (0.4) 490 (7.8)<br />
Qatar s 20 (0.6) 381 (4.1) 49 (0.8) 365 (2.6) 14 (0.5) 357 (4.0) 16 (0.6) 337 (3.7)<br />
Romania 38 (1.8) 523 (3.9) 33 (1.3) 496 (5.2) 9 (1.2) 445 (12.7) 20 (1.7) 460 (8.1)<br />
Russian Federation 48 (1.0) 575 (3.2) 40 (0.9) 565 (4.0) 5 (0.6) 533 (12.2) 6 (0.5) 543 (6.2)<br />
Scotl<strong>and</strong> x x x x x x x x x x x x x x x x<br />
Singapore 41 (0.7) 571 (3.0) 51 (0.8) 559 (3.2) 2 (0.2) ~ ~ 6 (0.3) 545 (5.2)<br />
Slovak Republic 62 (1.1) 547 (2.4) 29 (1.0) 535 (2.6) 5 (0.6) 446 (8.7) 3 (0.3) 514 (9.1)<br />
Slovenia 75 (0.8) 530 (2.2) 23 (0.7) 508 (3.3) 2 (0.2) ~ ~ 1 (0.2) ~ ~<br />
South Africa x x x x x x x x x x x x x x x x<br />
Spain s 36 (1.1) 532 (3.1) 50 (1.4) 523 (2.9) 3 (0.5) 488 (9.0) 10 (0.7) 520 (5.4)<br />
Sweden 44 (0.9) 556 (3.0) 51 (0.9) 551 (2.3) 3 (0.4) 537 (7.1) 2 (0.3) ~ ~<br />
Trinidad <strong>and</strong> Tobago r 39 (1.2) 467 (5.3) 49 (1.2) 432 (5.8) 5 (0.6) 394 (10.7) 6 (0.5) 445 (9.3)<br />
United States – – – – – – – – – – – – – – – –<br />
International Avg. 36 (0.2) 520 (0.8) 47 (0.2) 508 (0.6) 7 (0.1) 472 (2.1) 9 (0.1) 488 (1.5)<br />
Background data provided by parents.<br />
( ) St<strong>and</strong>ard errors appear in parentheses. Because results are rounded to the nearest<br />
whole number, some totals may appear inconsistent.<br />
An “r” indicates data are available for 70–84% of the students. An “s” indicates data are<br />
available for 50–69% of the students. An “x” indicates data are available for less than<br />
50% of the students.<br />
<strong>PIRLS</strong> 2006<br />
4th Grade<br />
A dash (–) indicates comparable data are not available. A tilde (~) indicates insufficient<br />
data to report achievement.<br />
NOTE: The International Average does not include the results from the Canadian provinces.<br />
SOURCE: IEA Progress in International Reading Literacy Study (<strong>PIRLS</strong>) 2006


