

here - TIMSS and PIRLS Home - Boston College
here - TIMSS and PIRLS Home - Boston College
here - TIMSS and PIRLS Home - Boston College

Create successful ePaper yourself
Turn your PDF publications into a flip-book with our unique Google optimized e-Paper software.
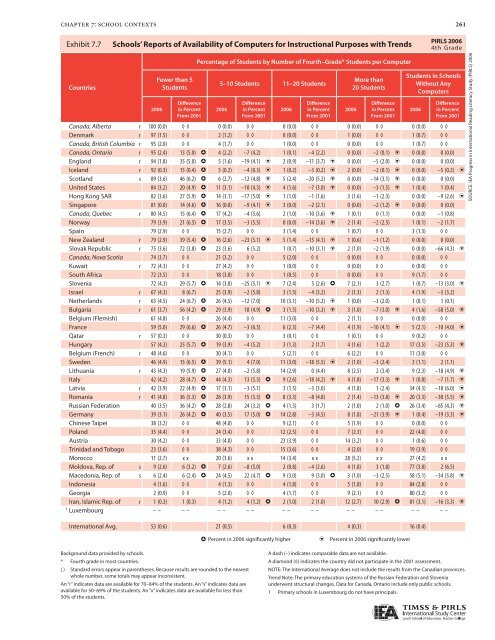
chapter 7: school contexts<br />
Exhibit 7.7: 7.7 Schools’ Reports of of Availability of of Computers for for Instructional Purposes with with Trends<br />
Countries<br />
2006<br />
Fewer than 5<br />
Students<br />
Difference<br />
in Percent<br />
From 2001<br />
Percentage of Students by Number of Fourth–Grade* Students per Computer<br />
5–10 Students 11–20 Students<br />
2006<br />
Difference<br />
in Percent<br />
From 2001<br />
2006<br />
Difference<br />
in Percent<br />
From 2001<br />
More than<br />
20 Students<br />
2006<br />
Difference<br />
in Percent<br />
From 2001<br />
261<br />
Students in Schools<br />
Without Any<br />
Computers<br />
2006<br />
Difference<br />
in Percent<br />
From 2001<br />
Canada, Alberta r 100 (0.0) ◊ ◊ 0 (0.0) ◊ ◊ 0 (0.0) ◊ ◊ 0 (0.0) ◊ ◊ 0 (0.0) ◊ ◊<br />
Denmark r 97 (1.5) ◊ ◊ 2 (1.2) ◊ ◊ 0 (0.0) ◊ ◊ 1 (0.0) ◊ ◊ 1 (0.7) ◊ ◊<br />
Canada, British Columbia r 95 (2.0) ◊ ◊ 4 (1.7) ◊ ◊ 1 (0.0) ◊ ◊ 0 (0.0) ◊ ◊ 1 (0.7) ◊ ◊<br />
Canada, Ontario r 95 (2.4) 13 (5.0) h 4 (2.2) –7 (4.2) 1 (0.1) –4 (2.2) 0 (0.0) –2 (0.1) i 0 (0.0) 0 (0.0)<br />
Engl<strong>and</strong> r 94 (1.8) 35 (5.0) h 5 (1.6) –19 (4.1) i 2 (0.9) –11 (3.7) i 0 (0.0) –5 (2.0) i 0 (0.0) 0 (0.0)<br />
Icel<strong>and</strong> r 92 (0.3) 15 (0.4) h 5 (0.2) –4 (0.3) i 1 (0.2) –3 (0.2) i 2 (0.0) –2 (0.1) i 0 (0.0) –5 (0.2) i<br />
Scotl<strong>and</strong> s 89 (3.6) 46 (6.2) h 6 (2.7) –12 (4.8) i 5 (2.4) –20 (5.2) i 0 (0.0) –14 (3.1) i 0 (0.0) 0 (0.0)<br />
United States 84 (3.2) 20 (4.9) h 11 (3.1) –10 (4.3) i 4 (1.6) –7 (3.0) i 0 (0.0) –3 (1.5) i 1 (0.4) 1 (0.4)<br />
Hong Kong SAR 82 (3.6) 27 (5.9) h 14 (3.1) –17 (5.0) i 1 (1.0) –1 (1.6) 3 (1.6) –1 (2.3) 0 (0.0) –9 (2.6) i<br />
Singapore 81 (0.0) 14 (4.6) h 16 (0.0) –9 (4.1) i 3 (0.0) –2 (2.1) 0 (0.0) –2 (1.2) i 0 (0.0) 0 (0.0)<br />
Canada, Quebec r 80 (4.5) 15 (6.4) h 17 (4.2) –4 (5.6) 2 (1.0) –10 (3.6) i 1 (0.1) 0 (1.1) 0 (0.0) –1 (0.8)<br />
Norway 79 (3.9) 21 (6.5) h 17 (3.5) –3 (5.5) 0 (0.0) –14 (3.6) i 2 (1.4) –2 (2.5) 1 (0.1) –2 (1.7)<br />
Spain 79 (2.9) ◊ ◊ 15 (2.7) ◊ ◊ 3 (1.4) ◊ ◊ 1 (0.7) ◊ ◊ 3 (1.3) ◊ ◊<br />
New Zeal<strong>and</strong> r 79 (2.9) 39 (5.4) h 16 (2.6) –23 (5.1) i 5 (1.4) –15 (4.1) i 1 (0.6) –1 (1.2) 0 (0.0) 0 (0.0)<br />
Slovak Republic r 75 (3.6) 72 (3.8) h 23 (3.6) 6 (5.2) 1 (0.7) –10 (3.1) i 2 (1.0) –2 (1.9) 0 (0.0) –66 (4.3) i<br />
Canada, Nova Scotia 74 (3.7) ◊ ◊ 21 (3.2) ◊ ◊ 5 (2.0) ◊ ◊ 0 (0.0) ◊ ◊ 0 (0.0) ◊ ◊<br />
Kuwait r 72 (4.3) ◊ ◊ 27 (4.2) ◊ ◊ 1 (0.0) ◊ ◊ 0 (0.0) ◊ ◊ 0 (0.0) ◊ ◊<br />
South Africa 72 (3.5) ◊ ◊ 18 (3.0) ◊ ◊ 1 (0.5) ◊ ◊ 0 (0.0) ◊ ◊ 9 (1.7) ◊ ◊<br />
Slovenia 72 (4.3) 29 (5.7) h 14 (3.0) –25 (5.1) i 7 (2.4) 5 (2.6) h 7 (2.1) 3 (2.7) 1 (0.7) –13 (3.0) i<br />
Israel r 67 (4.3) 8 (6.7) 25 (3.9) –2 (5.8) 3 (1.5) –4 (3.2) 2 (1.3) 2 (1.3) 4 (1.9) –3 (3.2)<br />
Netherl<strong>and</strong>s r 63 (4.5) 24 (6.7) h 26 (4.5) –12 (7.0) 10 (3.1) –10 (5.2) i 1 (0.0) –3 (2.0) 1 (0.1) 1 (0.1)<br />
Bulgaria r 61 (3.7) 56 (4.2) h 29 (3.9) 18 (4.9) h 3 (1.5) –10 (3.3) i 3 (1.0) –7 (3.0) i 4 (1.6) –58 (5.0) i<br />
Belgium (Flemish) 61 (4.8) ◊ ◊ 26 (4.4) ◊ ◊ 11 (3.0) ◊ ◊ 2 (1.1) ◊ ◊ 0 (0.0) ◊ ◊<br />
France 59 (5.0) 29 (6.6) h 26 (4.7) –3 (6.5) 6 (2.3) –7 (4.4) 4 (1.9) –10 (4.1) i 5 (2.1) –10 (4.0) i<br />
Qatar r 57 (0.3) ◊ ◊ 30 (0.3) ◊ ◊ 3 (0.1) ◊ ◊ 1 (0.1) ◊ ◊ 9 (0.2) ◊ ◊<br />
Hungary 57 (4.3) 25 (5.7) h 19 (3.9) –4 (5.2) 3 (1.3) 2 (1.7) 4 (1.6) 1 (2.2) 17 (3.5) –23 (5.3) i<br />
Belgium (French) r 48 (4.6) ◊ ◊ 30 (4.1) ◊ ◊ 5 (2.1) ◊ ◊ 6 (2.2) ◊ ◊ 11 (3.0) ◊ ◊<br />
Sweden 46 (4.9) 15 (6.5) h 39 (5.1) 4 (7.0) 11 (3.0) –18 (5.5) i 2 (1.0) –3 (2.4) 2 (1.1) 2 (1.1)<br />
Lithuania r 43 (4.3) 19 (5.9) h 27 (4.0) –2 (5.8) 14 (2.9) 0 (4.4) 8 (2.5) 2 (3.4) 9 (2.3) –18 (4.9) i<br />
Italy 42 (4.2) 28 (4.7) h 44 (4.3) 13 (5.5) h 9 (2.6) –18 (4.2) i 4 (1.8) –17 (3.3) i 1 (0.8) –7 (1.7) i<br />
Latvia r 42 (3.9) 22 (4.9) h 17 (3.1) –3 (5.1) 3 (1.5) –3 (3.0) 4 (1.8) 1 (2.4) 34 (4.3) –18 (6.0) i<br />
Romania r 41 (4.8) 36 (5.3) h 28 (3.9) 15 (5.5) h 8 (3.3) –8 (4.8) 2 (1.4) –13 (3.8) i 20 (3.3) –30 (5.5) i<br />
Russian Federation 40 (3.5) 36 (4.2) h 28 (2.8) 24 (3.2) h 4 (1.5) 3 (1.7) 2 (1.0) 2 (1.0) h 26 (3.4) –65 (4.3) i<br />
Germany 39 (3.1) 26 (4.2) h 40 (3.5) 17 (5.0) h 14 (2.8) –3 (4.5) 8 (1.8) –21 (3.9) i 1 (0.4) –19 (3.3) i<br />
Chinese Taipei 38 (3.2) ◊ ◊ 48 (4.0) ◊ ◊ 9 (2.1) ◊ ◊ 5 (1.9) ◊ ◊ 0 (0.0) ◊ ◊<br />
Pol<strong>and</strong> 35 (4.4) ◊ ◊ 24 (3.4) ◊ ◊ 12 (2.5) ◊ ◊ 7 (2.3) ◊ ◊ 22 (4.0) ◊ ◊<br />
Austria 30 (4.2) ◊ ◊ 33 (4.0) ◊ ◊ 23 (3.9) ◊ ◊ 14 (3.2) ◊ ◊ 1 (0.6) ◊ ◊<br />
Trinidad <strong>and</strong> Tobago 23 (3.6) ◊ ◊ 38 (4.3) ◊ ◊ 15 (3.6) ◊ ◊ 4 (2.0) ◊ ◊ 19 (3.9) ◊ ◊<br />
Morocco 11 (2.7) x x 20 (3.6) x x 14 (3.4) x x 28 (5.2) x x 27 (4.2) x x<br />
Moldova, Rep. of s 9 (2.6) 6 (3.2) h 7 (2.6) –8 (5.0) 2 (0.8) –4 (2.6) 4 (1.8) 3 (1.8) 77 (3.8) 2 (6.5)<br />
Macedonia, Rep. of s 6 (2.4) 6 (2.4) h 24 (4.5) 22 (4.7) h 9 (3.0) 9 (3.0) h 3 (1.0) –3 (2.5) 58 (5.1) –34 (5.8) i<br />
Indonesia 4 (1.6) ◊ ◊ 4 (1.3) ◊ ◊ 4 (1.8) ◊ ◊ 5 (1.8) ◊ ◊ 84 (2.8) ◊ ◊<br />
Georgia 2 (0.9) ◊ ◊ 5 (2.0) ◊ ◊ 4 (1.7) ◊ ◊ 9 (2.1) ◊ ◊ 80 (3.2) ◊ ◊<br />
Iran, Islamic Rep. of r 1 (0.3) 1 (0.3) 4 (1.2) 4 (1.2) h 2 (1.0) 2 (1.0) 12 (2.7) 10 (2.9) h 81 (3.1) –16 (3.3) i<br />
1 Luxembourg – – – – – – – – – – – – – – – – – – – –<br />
International Avg. 53 (0.6) 21 (0.5) 6 (0.3) 4 (0.3) 16 (0.4)<br />
Background data provided by schools.<br />
* Fourth grade in most countries.<br />
( ) St<strong>and</strong>ard errors appear in parentheses. Because results are rounded to the nearest<br />
whole number, some totals may appear inconsistent.<br />
An “r” indicates data are available for 70–84% of the students. An “s” indicates data are<br />
available for 50–69% of the students. An “x” indicates data are available for less than<br />
50% of the students.<br />
h Percent in 2006 significantly higher i Percent in 2006 significantly lower<br />
A dash (–) indicates comparable data are not available.<br />
A diamond (◊) indicates the country did not participate in the 2001 assessment.<br />
NOTE: The International Average does not include the results from the Canadian provinces.<br />
Trend Note: The primary education systems of the Russian Federation <strong>and</strong> Slovenia<br />
underwent structural changes. Data for Canada, Ontario include only public schools.<br />
1 Primary schools in Luxembourg do not have principals.<br />
<strong>PIRLS</strong> 2006<br />
4th Grade<br />
SOURCE: IEA Progress in International Reading Literacy Study (<strong>PIRLS</strong>) 2006


