

here - TIMSS and PIRLS Home - Boston College
here - TIMSS and PIRLS Home - Boston College
here - TIMSS and PIRLS Home - Boston College

Create successful ePaper yourself
Turn your PDF publications into a flip-book with our unique Google optimized e-Paper software.
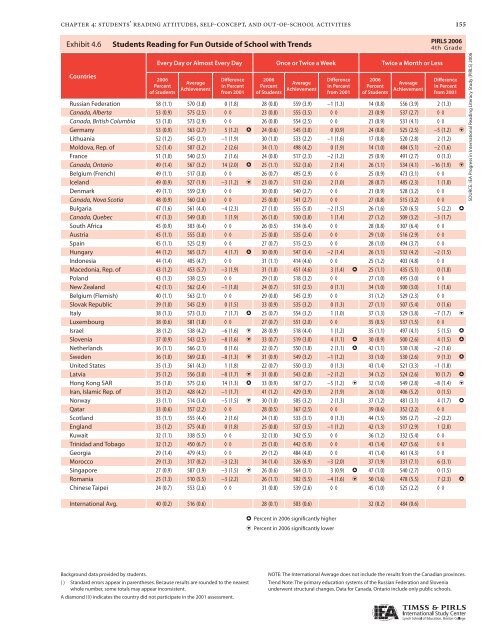
chapter 4: students’ reading attitudes, self-concept, <strong>and</strong> out-of-school activities<br />
Exhibit 4.6: 4.6 Students Reading for for Fun Fun Outside of of School with with Trends<br />
Countries<br />
Every Day or Almost Every Day Once or Twice a Week Twice a Month or Less<br />
2006<br />
Percent<br />
of Students<br />
Average<br />
Achievement<br />
Difference<br />
in Percent<br />
from 2001<br />
2006<br />
Percent<br />
of Students<br />
Average<br />
Achievement<br />
Difference<br />
in Percent<br />
from 2001<br />
2006<br />
Percent<br />
of Students<br />
Average<br />
Achievement<br />
Difference<br />
in Percent<br />
from 2001<br />
Russian Federation 58 (1.1) 570 (3.8) 0 (1.8) 28 (0.8) 559 (3.9) –1 (1.3) 14 (0.8) 556 (3.9) 2 (1.3)<br />
Canada, Alberta 53 (0.9) 575 (2.5) ◊ ◊ 23 (0.8) 555 (3.5) ◊ ◊ 23 (0.9) 537 (2.7) ◊ ◊<br />
Canada, British Columbia 53 (1.0) 573 (2.9) ◊ ◊ 26 (0.8) 554 (2.5) ◊ ◊ 21 (0.9) 531 (4.1) ◊ ◊<br />
Germany 53 (0.9) 563 (2.7) 5 (1.2) h 24 (0.6) 545 (3.0) 0 (0.9) 24 (0.8) 525 (2.5) –5 (1.2) i<br />
Lithuania 52 (1.2) 545 (2.1) –1 (1.9) 30 (1.0) 533 (2.2) –1 (1.6) 17 (0.8) 520 (2.8) 2 (1.2)<br />
Moldova, Rep. of 52 (1.4) 507 (3.2) 2 (2.6) 34 (1.1) 498 (4.2) 0 (1.9) 14 (1.0) 484 (5.1) –2 (1.6)<br />
France 51 (1.0) 540 (2.5) 2 (1.6) 24 (0.8) 517 (2.3) –2 (1.2) 25 (0.9) 491 (2.7) 0 (1.3)<br />
Canada, Ontario 49 (1.4) 567 (3.2) 14 (2.0) h 25 (1.1) 552 (3.6) 2 (1.4) 26 (1.1) 534 (4.1) –16 (1.9) i<br />
Belgium (French) 49 (1.1) 517 (3.0) ◊ ◊ 26 (0.7) 495 (2.9) ◊ ◊ 25 (0.9) 473 (3.1) ◊ ◊<br />
Icel<strong>and</strong> 49 (0.9) 527 (1.9) –3 (1.2) i 23 (0.7) 511 (2.6) 2 (1.0) 28 (0.7) 485 (2.3) 1 (1.0)<br />
Denmark 49 (1.1) 559 (2.9) ◊ ◊ 30 (0.8) 540 (2.7) ◊ ◊ 21 (0.9) 528 (3.2) ◊ ◊<br />
Canada, Nova Scotia 48 (0.9) 560 (2.6) ◊ ◊ 25 (0.8) 541 (2.7) ◊ ◊ 27 (0.8) 515 (3.2) ◊ ◊<br />
Bulgaria 47 (1.6) 561 (4.4) –4 (2.3) 27 (1.0) 555 (5.0) –2 (1.5) 26 (1.6) 520 (6.5) 5 (2.2) h<br />
Canada, Quebec 47 (1.3) 549 (3.0) 1 (1.9) 26 (1.0) 530 (3.8) 1 (1.4) 27 (1.2) 509 (3.2) –3 (1.7)<br />
South Africa 45 (0.9) 303 (6.4) ◊ ◊ 26 (0.5) 314 (6.4) ◊ ◊ 28 (0.8) 307 (6.4) ◊ ◊<br />
Austria 45 (1.1) 555 (3.0) ◊ ◊ 25 (0.8) 535 (2.4) ◊ ◊ 29 (1.0) 516 (2.9) ◊ ◊<br />
Spain 45 (1.1) 525 (2.9) ◊ ◊ 27 (0.7) 515 (2.5) ◊ ◊ 28 (1.0) 494 (3.7) ◊ ◊<br />
Hungary 44 (1.2) 565 (3.7) 4 (1.7) h 30 (0.9) 547 (3.4) –2 (1.4) 26 (1.1) 532 (4.2) –2 (1.5)<br />
Indonesia 44 (1.4) 405 (4.7) ◊ ◊ 31 (1.1) 414 (4.6) ◊ ◊ 25 (1.2) 403 (4.8) ◊ ◊<br />
Macedonia, Rep. of 43 (1.2) 453 (5.7) –3 (1.9) 31 (1.0) 451 (4.6) 3 (1.4) h 25 (1.1) 435 (5.1) 0 (1.8)<br />
Pol<strong>and</strong> 43 (1.3) 538 (2.5) ◊ ◊ 29 (1.0) 518 (3.2) ◊ ◊ 27 (1.0) 495 (3.0) ◊ ◊<br />
New Zeal<strong>and</strong> 42 (1.1) 562 (2.4) –1 (1.8) 24 (0.7) 531 (2.5) 0 (1.1) 34 (1.0) 500 (3.0) 1 (1.6)<br />
Belgium (Flemish) 40 (1.1) 563 (2.1) ◊ ◊ 29 (0.8) 545 (2.9) ◊ ◊ 31 (1.2) 529 (2.3) ◊ ◊<br />
Slovak Republic 39 (1.0) 545 (2.9) 0 (1.5) 33 (0.9) 535 (3.2) 0 (1.3) 27 (1.1) 507 (5.4) 0 (1.6)<br />
Italy 38 (1.3) 573 (3.3) 7 (1.7) h 25 (0.7) 554 (3.2) 1 (1.0) 37 (1.3) 529 (3.8) –7 (1.7) i<br />
Luxembourg 38 (0.6) 581 (1.8) ◊ ◊ 27 (0.7) 551 (2.0) ◊ ◊ 35 (0.5) 537 (1.5) ◊ ◊<br />
Israel 38 (1.2) 538 (4.2) –6 (1.6) i 28 (0.9) 518 (4.4) 1 (1.2) 35 (1.1) 497 (4.1) 5 (1.5) h<br />
Slovenia 37 (0.9) 543 (2.5) –8 (1.6) i 33 (0.7) 519 (3.0) 4 (1.1) h 30 (0.9) 500 (2.6) 4 (1.5) h<br />
Netherl<strong>and</strong>s 36 (1.1) 566 (2.1) 0 (1.6) 22 (0.7) 550 (1.8) 2 (1.1) h 42 (1.1) 530 (1.8) –2 (1.6)<br />
Sweden 36 (1.0) 569 (2.8) –8 (1.3) i 31 (0.9) 549 (3.2) –1 (1.2) 33 (1.0) 530 (2.6) 9 (1.3) h<br />
United States 35 (1.3) 561 (4.3) 1 (1.8) 22 (0.7) 550 (3.3) 0 (1.3) 43 (1.4) 521 (3.3) –1 (1.8)<br />
Latvia 35 (1.2) 556 (3.0) –8 (1.7) i 31 (0.8) 543 (2.8) –2 (1.2) 34 (1.2) 524 (2.6) 10 (1.7) h<br />
Hong Kong SAR 35 (1.0) 575 (2.6) 14 (1.3) h 33 (0.9) 567 (2.7) –5 (1.2) i 32 (1.0) 549 (2.8) –8 (1.4) i<br />
Iran, Islamic Rep. of 33 (1.2) 428 (4.2) –1 (1.7) 41 (1.2) 429 (3.9) 2 (1.9) 26 (1.0) 406 (5.2) 0 (1.5)<br />
Norway 33 (1.1) 514 (3.4) –5 (1.5) i 30 (1.0) 505 (3.2) 2 (1.3) 37 (1.2) 481 (3.1) 4 (1.7) h<br />
Qatar 33 (0.6) 357 (2.2) ◊ ◊ 28 (0.5) 367 (2.5) ◊ ◊ 39 (0.6) 352 (2.2) ◊ ◊<br />
Scotl<strong>and</strong> 33 (1.1) 555 (4.4) 2 (1.6) 24 (1.0) 533 (3.1) 0 (1.3) 44 (1.5) 505 (2.7) –2 (2.2)<br />
Engl<strong>and</strong> 33 (1.2) 575 (4.0) 0 (1.8) 25 (0.8) 537 (3.5) –1 (1.2) 42 (1.3) 517 (2.9) 1 (2.0)<br />
Kuwait 32 (1.1) 338 (5.5) ◊ ◊ 32 (1.0) 342 (5.5) ◊ ◊ 36 (1.2) 332 (5.4) ◊ ◊<br />
Trinidad <strong>and</strong> Tobago 32 (1.2) 450 (6.7) ◊ ◊ 25 (1.0) 442 (5.9) ◊ ◊ 43 (1.4) 427 (5.6) ◊ ◊<br />
Georgia 29 (1.4) 479 (4.5) ◊ ◊ 29 (1.2) 484 (4.0) ◊ ◊ 41 (1.4) 461 (4.3) ◊ ◊<br />
Morocco 29 (1.3) 317 (8.2) –3 (2.3) 34 (1.4) 326 (6.9) –3 (2.0) 37 (1.9) 331 (7.1) 6 (3.1)<br />
Singapore 27 (0.9) 587 (3.9) –3 (1.5) i 26 (0.6) 564 (3.1) 3 (0.9) h 47 (1.0) 540 (2.7) 0 (1.5)<br />
Romania 25 (1.3) 510 (5.5) –3 (2.2) 26 (1.1) 502 (5.5) –4 (1.6) i 50 (1.6) 478 (5.5) 7 (2.3) h<br />
Chinese Taipei 24 (0.7) 553 (2.6) ◊ ◊ 31 (0.8) 539 (2.6) ◊ ◊ 45 (1.0) 525 (2.2) ◊ ◊<br />
International Avg. 40 (0.2) 516 (0.6) 28 (0.1) 503 (0.6) 32 (0.2) 484 (0.6)<br />
Background data provided by students.<br />
( ) St<strong>and</strong>ard errors appear in parentheses. Because results are rounded to the nearest<br />
whole number, some totals may appear inconsistent.<br />
A diamond (◊) indicates the country did not participate in the 2001 assessment.<br />
h Percent in 2006 significantly higher<br />
i Percent in 2006 significantly lower<br />
155<br />
<strong>PIRLS</strong> 2006<br />
4th Grade<br />
NOTE: The International Average does not include the results from the Canadian provinces.<br />
Trend Note: The primary education systems of the Russian Federation <strong>and</strong> Slovenia<br />
underwent structural changes. Data for Canada, Ontario include only public schools.<br />
SOURCE: IEA Progress in International Reading Literacy Study (<strong>PIRLS</strong>) 2006


