

here - TIMSS and PIRLS Home - Boston College
here - TIMSS and PIRLS Home - Boston College
here - TIMSS and PIRLS Home - Boston College

Create successful ePaper yourself
Turn your PDF publications into a flip-book with our unique Google optimized e-Paper software.
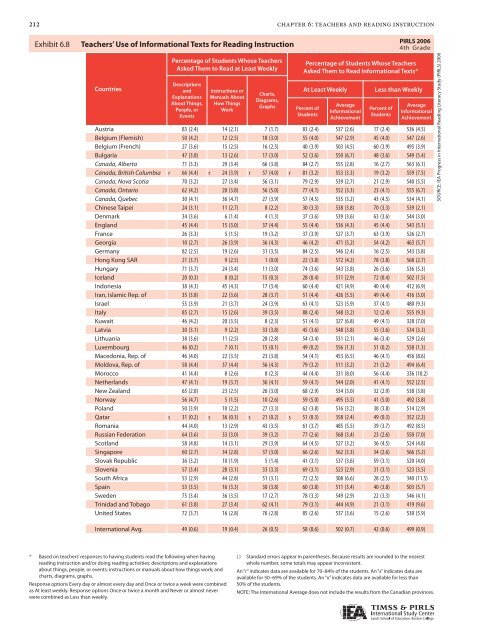
212 chapter 6: teachers <strong>and</strong> reading instruction<br />
Exhibit 6.8 Teachers’ Exhibit 6.8: Use Teachers’ of Informational Use of Informational Texts for Reading Texts Instruction<br />
for Reading Instruction<br />
Countries<br />
Percentage of Students Whose Teachers<br />
Asked Them to Read at Least Weekly<br />
Descriptions<br />
<strong>and</strong><br />
Explanations<br />
About Things,<br />
People, or<br />
Events<br />
Instructions or<br />
Manuals About<br />
How Things<br />
Work<br />
Charts,<br />
Diagrams,<br />
Graphs<br />
Percentage of Students Whose Teachers<br />
Asked Them to Read Informational Texts*<br />
At Least Weekly Less than Weekly<br />
Percent of<br />
Students<br />
Average<br />
Informational<br />
Achievement<br />
Percent of<br />
Students<br />
Average<br />
Informational<br />
Achievement<br />
Austria 83 (2.4) 14 (2.1) 7 (1.7) 83 (2.4) 537 (2.6) 17 (2.4) 536 (4.5)<br />
Belgium (Flemish) 50 (4.2) 12 (2.5) 18 (3.0) 55 (4.0) 547 (2.9) 45 (4.0) 547 (2.6)<br />
Belgium (French) 27 (3.6) 15 (2.5) 16 (2.5) 40 (3.9) 503 (4.5) 60 (3.9) 495 (3.9)<br />
Bulgaria 47 (3.8) 13 (2.6) 17 (3.0) 52 (3.6) 550 (6.7) 48 (3.6) 549 (5.4)<br />
Canada, Alberta 71 (3.3) 29 (3.4) 66 (3.8) 84 (2.7) 555 (2.8) 16 (2.7) 563 (6.1)<br />
Canada, British Columbia r 66 (4.4) r 24 (3.9) r 57 (4.0) r 81 (3.2) 553 (3.3) 19 (3.2) 559 (7.5)<br />
Canada, Nova Scotia 70 (3.2) 27 (3.4) 56 (3.1) 79 (2.9) 539 (2.7) 21 (2.9) 540 (5.5)<br />
Canada, Ontario 62 (4.2) 20 (3.8) 56 (5.0) 77 (4.1) 552 (3.3) 23 (4.1) 555 (6.7)<br />
Canada, Quebec 30 (4.1) 36 (4.7) 27 (3.9) 57 (4.5) 535 (3.2) 43 (4.5) 534 (4.1)<br />
Chinese Taipei 24 (3.1) 11 (2.7) 8 (2.2) 30 (3.3) 538 (3.8) 70 (3.3) 539 (2.1)<br />
Denmark 34 (3.6) 6 (1.4) 4 (1.3) 37 (3.6) 539 (3.6) 63 (3.6) 544 (3.0)<br />
Engl<strong>and</strong> 45 (4.4) 15 (3.0) 37 (4.4) 55 (4.4) 536 (4.3) 45 (4.4) 543 (5.1)<br />
France 26 (3.3) 5 (1.5) 19 (3.2) 37 (3.9) 527 (3.7) 63 (3.9) 526 (2.7)<br />
Georgia 10 (2.7) 26 (3.9) 36 (4.3) 46 (4.2) 471 (5.2) 54 (4.2) 463 (5.7)<br />
Germany 82 (2.5) 19 (2.6) 31 (3.5) 84 (2.5) 546 (2.4) 16 (2.5) 543 (3.8)<br />
Hong Kong SAR 21 (3.7) 9 (2.5) 1 (0.0) 22 (3.8) 572 (4.2) 78 (3.8) 568 (2.7)<br />
Hungary 71 (3.7) 24 (3.4) 11 (3.0) 74 (3.6) 543 (3.8) 26 (3.6) 536 (5.3)<br />
Icel<strong>and</strong> 20 (0.3) 8 (0.2) 15 (0.3) 28 (0.4) 511 (2.9) 72 (0.4) 502 (1.5)<br />
Indonesia 38 (4.3) 45 (4.3) 17 (3.4) 60 (4.4) 421 (4.9) 40 (4.4) 412 (6.9)<br />
Iran, Islamic Rep. of 35 (3.8) 22 (3.6) 28 (3.7) 51 (4.4) 426 (5.5) 49 (4.4) 416 (5.0)<br />
Israel 55 (3.9) 21 (3.7) 24 (3.9) 63 (4.1) 523 (5.9) 37 (4.1) 480 (9.3)<br />
Italy 85 (2.7) 15 (2.6) 39 (3.5) 88 (2.4) 548 (3.2) 12 (2.4) 555 (9.3)<br />
Kuwait 46 (4.2) 20 (3.5) 8 (2.3) 51 (4.1) 327 (6.8) 49 (4.1) 328 (7.0)<br />
Latvia 30 (3.1) 9 (2.2) 33 (3.8) 45 (3.6) 548 (3.8) 55 (3.6) 534 (3.3)<br />
Lithuania 38 (3.6) 11 (2.5) 28 (2.8) 54 (3.4) 531 (2.1) 46 (3.4) 529 (2.6)<br />
Luxembourg 46 (0.2) 7 (0.1) 15 (0.1) 49 (0.2) 556 (1.3) 51 (0.2) 558 (1.3)<br />
Macedonia, Rep. of 46 (4.0) 22 (3.5) 23 (3.8) 54 (4.1) 453 (6.5) 46 (4.1) 456 (8.6)<br />
Moldova, Rep. of 58 (4.4) 37 (4.4) 56 (4.3) 79 (3.2) 511 (3.2) 21 (3.2) 494 (6.4)<br />
Morocco 41 (4.4) 8 (2.6) 8 (2.3) 44 (4.4) 331 (8.0) 56 (4.4) 336 (10.2)<br />
Netherl<strong>and</strong>s 47 (4.1) 19 (3.7) 36 (4.1) 59 (4.1) 544 (2.0) 41 (4.1) 552 (2.5)<br />
New Zeal<strong>and</strong> 65 (2.8) 23 (2.5) 26 (3.0) 68 (2.9) 534 (3.0) 32 (2.9) 538 (3.8)<br />
Norway 56 (4.7) 5 (1.5) 10 (2.6) 59 (5.0) 495 (3.5) 41 (5.0) 492 (3.8)<br />
Pol<strong>and</strong> 50 (3.9) 10 (2.2) 27 (3.3) 62 (3.8) 516 (3.2) 38 (3.8) 514 (2.9)<br />
Qatar s 31 (0.2) s 36 (0.3) s 21 (0.2) s 51 (0.3) 358 (2.4) 49 (0.3) 352 (2.2)<br />
Romania 44 (4.0) 13 (2.9) 43 (3.5) 61 (3.7) 485 (5.5) 39 (3.7) 492 (8.5)<br />
Russian Federation 64 (3.6) 33 (3.0) 39 (3.2) 77 (2.6) 568 (3.4) 23 (2.6) 550 (7.0)<br />
Scotl<strong>and</strong> 58 (4.8) 14 (3.1) 29 (3.9) 64 (4.5) 527 (3.2) 36 (4.5) 524 (4.8)<br />
Singapore 60 (2.7) 34 (2.8) 37 (3.0) 66 (2.6) 562 (3.3) 34 (2.6) 566 (5.2)<br />
Slovak Republic 36 (3.2) 10 (1.9) 5 (1.4) 41 (3.1) 537 (3.6) 59 (3.1) 520 (4.0)<br />
Slovenia 57 (3.4) 28 (3.1) 33 (3.3) 69 (3.1) 523 (2.9) 31 (3.1) 523 (3.5)<br />
South Africa 53 (2.9) 44 (2.8) 51 (3.1) 72 (2.5) 308 (6.6) 28 (2.5) 340 (11.5)<br />
Spain 53 (3.5) 16 (3.3) 30 (3.8) 60 (3.8) 511 (3.4) 40 (3.8) 503 (5.7)<br />
Sweden 75 (3.4) 36 (3.5) 17 (2.7) 78 (3.3) 549 (2.9) 22 (3.3) 546 (4.1)<br />
Trinidad <strong>and</strong> Tobago 61 (3.8) 27 (3.4) 62 (4.1) 79 (3.1) 444 (4.9) 21 (3.1) 419 (9.6)<br />
United States 72 (3.7) 16 (2.8) 76 (2.8) 85 (2.6) 537 (3.6) 15 (2.6) 530 (5.9)<br />
International Avg. 49 (0.6) 19 (0.4) 26 (0.5) 58 (0.6) 502 (0.7) 42 (0.6) 499 (0.9)<br />
* Based on teachers’ responses to having students read the following when having<br />
reading instruction <strong>and</strong>/or doing reading activities: descriptions <strong>and</strong> explanations<br />
about things, people, or events; instructions or manuals about how things work; <strong>and</strong><br />
charts, diagrams, graphs.<br />
Response options Every day or almost every day <strong>and</strong> Once or twice a week were combined<br />
as At least weekly. Response options Once or twice a month <strong>and</strong> Never or almost never<br />
were combined as Less than weekly.<br />
<strong>PIRLS</strong> 2006<br />
4th Grade<br />
( ) St<strong>and</strong>ard errors appear in parentheses. Because results are rounded to the nearest<br />
whole number, some totals may appear inconsistent.<br />
An “r” indicates data are available for 70–84% of the students. An “s” indicates data are<br />
available for 50–69% of the students. An “x” indicates data are available for less than<br />
50% of the students.<br />
NOTE: The International Average does not include the results from the Canadian provinces.<br />
SOURCE: IEA Progress in International Reading Literacy Study (<strong>PIRLS</strong>) 2006


