

here - TIMSS and PIRLS Home - Boston College
here - TIMSS and PIRLS Home - Boston College
here - TIMSS and PIRLS Home - Boston College

Create successful ePaper yourself
Turn your PDF publications into a flip-book with our unique Google optimized e-Paper software.
chapter 4: students’ reading attitudes, self-concept, <strong>and</strong> out-of-school activities<br />
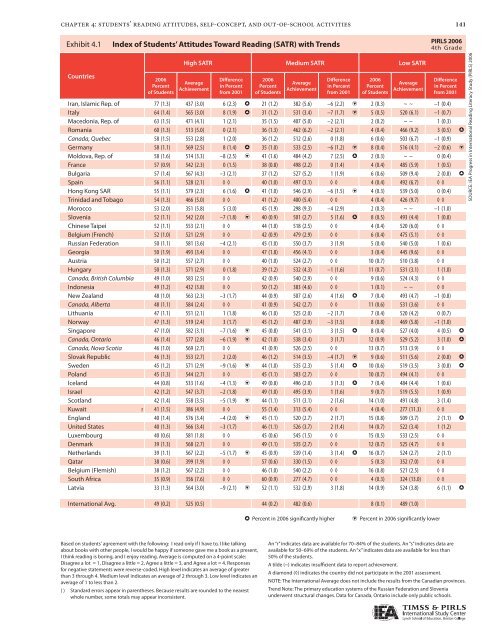
Exhibit 4.1: 4.1 Index Index of of Students’ Attitudes Toward Reading (SATR) with with Trends<br />
Countries<br />
2006<br />
Percent<br />
of Students<br />
High SATR Medium SATR Low SATR<br />
Average<br />
Achievement<br />
Difference<br />
in Percent<br />
from 2001<br />
2006<br />
Percent<br />
of Students<br />
Average<br />
Achievement<br />
Difference<br />
in Percent<br />
from 2001<br />
2006<br />
Percent<br />
of Students<br />
Average<br />
Achievement<br />
Difference<br />
in Percent<br />
from 2001<br />
Iran, Islamic Rep. of 77 (1.3) 437 (3.0) 6 (2.3) h 21 (1.2) 382 (5.6) –6 (2.2) i 2 (0.3) ~ ~ –1 (0.4)<br />
Italy 64 (1.4) 565 (3.0) 8 (1.9) h 31 (1.2) 531 (3.4) –7 (1.7) i 5 (0.5) 520 (6.1) –1 (0.7)<br />
Macedonia, Rep. of 63 (1.5) 471 (4.1) 1 (2.1) 35 (1.5) 407 (5.0) –2 (2.1) 2 (0.2) ~ ~ 1 (0.3)<br />
Romania 60 (1.3) 513 (5.0) 0 (2.1) 36 (1.3) 462 (6.2) –2 (2.1) 4 (0.4) 466 (9.2) 3 (0.5) h<br />
Canada, Quebec 58 (1.5) 553 (2.8) 1 (2.0) 36 (1.2) 512 (2.6) 0 (1.8) 6 (0.6) 503 (6.7) –1 (0.9)<br />
Germany 58 (1.1) 569 (2.5) 8 (1.4) h 35 (1.0) 533 (2.5) –6 (1.2) i 8 (0.4) 516 (4.1) –2 (0.6) i<br />
Moldova, Rep. of 58 (1.6) 514 (3.3) –8 (2.5) i 41 (1.6) 484 (4.2) 7 (2.5) h 2 (0.3) ~ ~ 0 (0.4)<br />
France 57 (0.9) 542 (2.3) 0 (1.5) 38 (0.8) 498 (2.2) 0 (1.4) 4 (0.4) 485 (5.9) 1 (0.5)<br />
Bulgaria 57 (1.4) 567 (4.3) –3 (2.1) 37 (1.2) 527 (5.2) 1 (1.9) 6 (0.6) 509 (9.4) 2 (0.8) h<br />
Spain 56 (1.1) 528 (2.1) ◊ ◊ 40 (1.0) 497 (3.1) ◊ ◊ 4 (0.4) 492 (6.7) ◊ ◊<br />
Hong Kong SAR 55 (1.1) 579 (2.3) 6 (1.6) h 41 (1.0) 546 (2.9) –6 (1.5) i 4 (0.3) 539 (5.0) 0 (0.4)<br />
Trinidad <strong>and</strong> Tobago 54 (1.3) 466 (5.0) ◊ ◊ 41 (1.2) 400 (5.4) ◊ ◊ 4 (0.4) 426 (9.7) ◊ ◊<br />
Morocco 53 (2.0) 351 (5.8) 5 (3.0) 45 (1.9) 298 (9.3) –4 (2.9) 2 (0.3) ~ ~ –1 (1.0)<br />
Slovenia 52 (1.1) 542 (2.0) –7 (1.8) i 40 (0.9) 501 (2.7) 5 (1.6) h 8 (0.5) 493 (4.4) 1 (0.8)<br />
Chinese Taipei 52 (1.1) 553 (2.1) ◊ ◊ 44 (1.0) 518 (2.5) ◊ ◊ 4 (0.4) 520 (6.0) ◊ ◊<br />
Belgium (French) 52 (1.0) 521 (2.9) ◊ ◊ 42 (0.9) 479 (2.9) ◊ ◊ 6 (0.4) 475 (5.1) ◊ ◊<br />
Russian Federation 50 (1.1) 581 (3.6) –4 (2.1) 45 (1.0) 550 (3.7) 3 (1.9) 5 (0.4) 540 (5.0) 1 (0.6)<br />
Georgia 50 (1.9) 493 (3.4) ◊ ◊ 47 (1.8) 456 (4.1) ◊ ◊ 3 (0.4) 445 (9.6) ◊ ◊<br />
Austria 50 (1.2) 557 (2.7) ◊ ◊ 40 (1.0) 524 (2.7) ◊ ◊ 10 (0.7) 510 (3.8) ◊ ◊<br />
Hungary 50 (1.3) 571 (2.9) 0 (1.8) 39 (1.2) 532 (4.3) –1 (1.6) 11 (0.7) 531 (3.1) 1 (1.0)<br />
Canada, British Columbia 49 (1.0) 583 (2.5) ◊ ◊ 42 (0.9) 540 (2.9) ◊ ◊ 9 (0.6) 524 (4.3) ◊ ◊<br />
Indonesia 49 (1.2) 432 (3.8) ◊ ◊ 50 (1.2) 383 (4.6) ◊ ◊ 1 (0.1) ~ ~ ◊ ◊<br />
New Zeal<strong>and</strong> 48 (1.0) 563 (2.3) –3 (1.7) 44 (0.9) 507 (2.6) 4 (1.6) h 7 (0.4) 493 (4.7) –1 (0.8)<br />
Canada, Alberta 48 (1.1) 584 (2.4) ◊ ◊ 41 (0.9) 542 (2.7) ◊ ◊ 11 (0.6) 531 (3.6) ◊ ◊<br />
Lithuania 47 (1.1) 551 (2.1) 1 (1.8) 46 (1.0) 525 (2.0) –2 (1.7) 7 (0.4) 520 (4.2) 0 (0.7)<br />
Norway 47 (1.3) 519 (2.4) 3 (1.7) 45 (1.2) 487 (2.9) –3 (1.5) 8 (0.8) 469 (5.8) –1 (1.0)<br />
Singapore 47 (1.0) 582 (3.1) –7 (1.6) i 45 (0.8) 541 (3.1) 3 (1.5) h 8 (0.4) 527 (4.0) 4 (0.5) h<br />
Canada, Ontario 46 (1.4) 577 (2.8) –6 (1.9) i 42 (1.0) 538 (3.4) 3 (1.7) 12 (0.9) 529 (5.2) 3 (1.0) h<br />
Canada, Nova Scotia 46 (1.0) 569 (2.7) ◊ ◊ 41 (0.9) 526 (2.5) ◊ ◊ 13 (0.7) 513 (3.9) ◊ ◊<br />
Slovak Republic 46 (1.3) 553 (2.7) 2 (2.0) 46 (1.2) 514 (3.5) –4 (1.7) i 9 (0.6) 511 (5.6) 2 (0.8) h<br />
Sweden 45 (1.2) 571 (2.9) –9 (1.6) i 44 (1.0) 535 (2.3) 5 (1.4) h 10 (0.6) 519 (3.5) 3 (0.8) h<br />
Pol<strong>and</strong> 45 (1.3) 544 (2.7) ◊ ◊ 45 (1.1) 503 (2.7) ◊ ◊ 10 (0.7) 494 (4.1) ◊ ◊<br />
Icel<strong>and</strong> 44 (0.8) 533 (1.6) –4 (1.3) i 49 (0.8) 496 (2.0) 3 (1.3) h 7 (0.4) 484 (4.4) 1 (0.6)<br />
Israel 42 (1.2) 547 (3.7) –2 (1.8) 49 (1.0) 495 (3.9) 1 (1.6) 9 (0.7) 519 (5.5) 1 (0.9)<br />
Scotl<strong>and</strong> 42 (1.4) 558 (3.5) –5 (1.9) i 44 (1.1) 511 (3.1) 2 (1.6) 14 (1.0) 491 (4.8) 3 (1.4)<br />
Kuwait r 41 (1.5) 386 (4.9) ◊ ◊ 55 (1.4) 313 (5.4) ◊ ◊ 4 (0.4) 277 (11.3) ◊ ◊<br />
Engl<strong>and</strong> 40 (1.4) 576 (3.4) –4 (2.0) i 45 (1.1) 520 (2.7) 2 (1.7) 15 (0.8) 509 (3.7) 2 (1.1) h<br />
United States 40 (1.3) 566 (3.4) –3 (1.7) 46 (1.1) 526 (3.7) 2 (1.4) 14 (0.7) 522 (3.4) 1 (1.2)<br />
Luxembourg 40 (0.6) 581 (1.8) ◊ ◊ 45 (0.6) 545 (1.5) ◊ ◊ 15 (0.5) 533 (2.5) ◊ ◊<br />
Denmark 39 (1.3) 568 (2.7) ◊ ◊ 49 (1.1) 535 (2.7) ◊ ◊ 12 (0.7) 525 (4.7) ◊ ◊<br />
Netherl<strong>and</strong>s 39 (1.1) 567 (2.2) –5 (1.7) i 45 (0.9) 539 (1.4) 3 (1.4) h 16 (0.7) 524 (2.7) 2 (1.1)<br />
Qatar 38 (0.6) 399 (1.9) ◊ ◊ 57 (0.6) 330 (1.5) ◊ ◊ 5 (0.3) 352 (7.0) ◊ ◊<br />
Belgium (Flemish) 38 (1.2) 567 (2.2) ◊ ◊ 46 (1.0) 540 (2.2) ◊ ◊ 16 (0.8) 521 (2.5) ◊ ◊<br />
South Africa 35 (0.9) 356 (7.6) ◊ ◊ 60 (0.9) 277 (4.7) ◊ ◊ 4 (0.3) 324 (13.0) ◊ ◊<br />
Latvia 33 (1.3) 564 (3.0) –9 (2.1) i 52 (1.1) 532 (2.9) 3 (1.8) 14 (0.9) 524 (3.8) 6 (1.1) h<br />
International Avg. 49 (0.2) 525 (0.5) 44 (0.2) 482 (0.6) 8 (0.1) 489 (1.0)<br />
Based on students' agreement with the following: I read only if I have to, I like talking<br />
about books with other people, I would be happy if someone gave me a book as a present,<br />
I think reading is boring, <strong>and</strong> I enjoy reading. Average is computed on a 4-point scale:<br />
Disagree a lot = 1, Disagree a little = 2, Agree a little = 3, <strong>and</strong> Agree a lot = 4. Responses<br />
for negative statements were reverse-coded. High level indicates an average of greater<br />
than 3 through 4. Medium level indicates an average of 2 through 3. Low level indicates an<br />
average of 1 to less than 2.<br />
( ) St<strong>and</strong>ard errors appear in parentheses. Because results are rounded to the nearest<br />
whole number, some totals may appear inconsistent.<br />
h Percent in 2006 significantly higher i Percent in 2006 significantly lower<br />
An “r” indicates data are available for 70–84% of the students. An “s” indicates data are<br />
available for 50–69% of the students. An “x” indicates data are available for less than<br />
50% of the students.<br />
A tilde (~) indicates insufficient data to report achievement.<br />
A diamond (◊) indicates the country did not participate in the 2001 assessment.<br />
141<br />
<strong>PIRLS</strong> 2006<br />
4th Grade<br />
NOTE: The International Average does not include the results from the Canadian provinces.<br />
Trend Note: The primary education systems of the Russian Federation <strong>and</strong> Slovenia<br />
underwent structural changes. Data for Canada, Ontario include only public schools.<br />
SOURCE: IEA Progress in International Reading Literacy Study (<strong>PIRLS</strong>) 2006


