

here - TIMSS and PIRLS Home - Boston College
here - TIMSS and PIRLS Home - Boston College
here - TIMSS and PIRLS Home - Boston College

Create successful ePaper yourself
Turn your PDF publications into a flip-book with our unique Google optimized e-Paper software.
224 chapter 6: teachers <strong>and</strong> reading instruction<br />
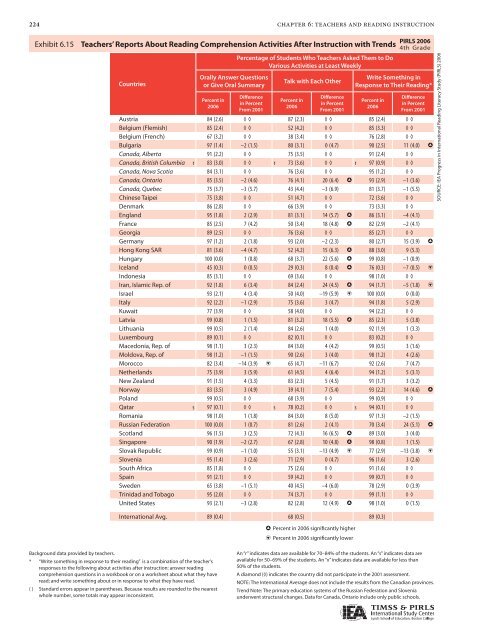
Exhibit 6.15: Teachers’ Reports About Reading Comprehension Activities After Instruction<br />
<strong>PIRLS</strong> 2006<br />
Exhibit 6.15 Teachers’ Reports About Reading Comprehension Activities After Instruction with Trends<br />
with Trends<br />
4th Grade<br />
Percentage of Students Who Teachers Asked Them to Do<br />
Various Activities at Least Weekly<br />
Background data provided by teachers.<br />
Countries<br />
Orally Answer Questions<br />
or Give Oral Summary<br />
Percent in<br />
2006<br />
Difference<br />
in Percent<br />
From 2001<br />
Talk with Each Other<br />
Percent in<br />
2006<br />
Difference<br />
in Percent<br />
From 2001<br />
Write Something in<br />
Response to Their Reading*<br />
Percent in<br />
2006<br />
Difference<br />
in Percent<br />
From 2001<br />
Austria 84 (2.6) ◊ ◊ 87 (2.3) ◊ ◊ 85 (2.4) ◊ ◊<br />
Belgium (Flemish) 85 (2.4) ◊ ◊ 52 (4.2) ◊ ◊ 85 (3.3) ◊ ◊<br />
Belgium (French) 67 (3.2) ◊ ◊ 38 (3.4) ◊ ◊ 76 (2.8) ◊ ◊<br />
Bulgaria 97 (1.4) –2 (1.5) 80 (3.1) 0 (4.7) 90 (2.5) 11 (4.0) h<br />
Canada, Alberta 91 (2.2) ◊ ◊ 75 (3.5) ◊ ◊ 91 (2.4) ◊ ◊<br />
Canada, British Columbia r 83 (3.0) ◊ ◊ r 73 (3.6) ◊ ◊ r 97 (0.9) ◊ ◊<br />
Canada, Nova Scotia 84 (3.1) ◊ ◊ 76 (3.6) ◊ ◊ 95 (1.2) ◊ ◊<br />
Canada, Ontario 85 (3.5) –2 (4.6) 76 (4.1) 20 (6.4) h 93 (2.9) –1 (3.6)<br />
Canada, Quebec 75 (3.7) –3 (5.7) 43 (4.4) –3 (6.9) 81 (3.7) –1 (5.5)<br />
Chinese Taipei 75 (3.8) ◊ ◊ 51 (4.7) ◊ ◊ 72 (3.6) ◊ ◊<br />
Denmark 86 (2.8) ◊ ◊ 66 (3.9) ◊ ◊ 73 (3.3) ◊ ◊<br />
Engl<strong>and</strong> 95 (1.8) 2 (2.9) 81 (3.1) 14 (5.7) h 86 (3.1) –4 (4.1)<br />
France 85 (2.5) 7 (4.2) 50 (3.4) 18 (4.8) h 82 (2.9) –2 (4.1)<br />
Georgia 89 (2.5) ◊ ◊ 76 (3.6) ◊ ◊ 85 (2.7) ◊ ◊<br />
Germany 97 (1.2) 2 (1.8) 93 (2.0) –2 (2.3) 80 (2.7) 15 (3.9) h<br />
Hong Kong SAR 81 (3.6) –4 (4.7) 52 (4.2) 15 (6.3) h 88 (3.0) 9 (5.3)<br />
Hungary 100 (0.0) 1 (0.8) 68 (3.7) 22 (5.6) h 99 (0.8) –1 (0.9)<br />
Icel<strong>and</strong> 45 (0.3) 0 (0.5) 29 (0.3) 8 (0.4) h 76 (0.3) –7 (0.5) i<br />
Indonesia 85 (3.1) ◊ ◊ 69 (3.6) ◊ ◊ 98 (1.0) ◊ ◊<br />
Iran, Islamic Rep. of 92 (1.8) 6 (3.4) 84 (2.4) 24 (4.5) h 94 (1.7) –5 (1.8) i<br />
Israel 93 (2.1) 4 (3.4) 50 (4.0) –19 (5.9) i 100 (0.0) 0 (0.0)<br />
Italy 92 (2.2) –1 (2.9) 75 (3.6) 3 (4.7) 94 (1.8) 5 (2.9)<br />
Kuwait 77 (3.9) ◊ ◊ 58 (4.0) ◊ ◊ 94 (2.2) ◊ ◊<br />
Latvia 99 (0.8) 1 (1.5) 81 (3.2) 18 (5.5) h 85 (2.3) 5 (3.8)<br />
Lithuania 99 (0.5) 2 (1.4) 84 (2.6) 1 (4.0) 92 (1.9) 1 (3.3)<br />
Luxembourg 89 (0.1) ◊ ◊ 82 (0.1) ◊ ◊ 83 (0.2) ◊ ◊<br />
Macedonia, Rep. of 98 (1.1) 3 (2.3) 84 (3.0) 4 (4.2) 99 (0.5) 3 (1.6)<br />
Moldova, Rep. of 98 (1.2) –1 (1.5) 90 (2.6) 3 (4.0) 98 (1.2) 4 (2.6)<br />
Morocco 82 (3.4) –14 (3.9) i 65 (4.7) –11 (6.7) 92 (2.6) 7 (4.7)<br />
Netherl<strong>and</strong>s 75 (3.9) 3 (5.9) 61 (4.5) 4 (6.4) 94 (1.2) 5 (3.1)<br />
New Zeal<strong>and</strong> 91 (1.5) 4 (3.3) 83 (2.3) 5 (4.5) 91 (1.7) 3 (3.2)<br />
Norway 83 (3.5) 3 (4.9) 39 (4.1) 7 (5.4) 93 (2.2) 14 (4.6) h<br />
Pol<strong>and</strong> 99 (0.5) ◊ ◊ 68 (3.9) ◊ ◊ 99 (0.9) ◊ ◊<br />
Qatar s 97 (0.1) ◊ ◊ s 78 (0.2) ◊ ◊ s 94 (0.1) ◊ ◊<br />
Romania 98 (1.0) 1 (1.8) 84 (3.0) 8 (5.0) 97 (1.3) –2 (1.5)<br />
Russian Federation 100 (0.0) 1 (0.7) 81 (2.6) 2 (4.1) 70 (3.4) 24 (5.1) h<br />
Scotl<strong>and</strong> 96 (1.5) 3 (2.5) 72 (4.3) 16 (6.5) h 89 (3.0) 3 (4.0)<br />
Singapore 90 (1.9) –2 (2.7) 67 (2.8) 10 (4.8) h 98 (0.8) 1 (1.5)<br />
Slovak Republic 99 (0.9) –1 (1.0) 55 (3.1) –13 (4.9) i 77 (2.9) –13 (3.8) i<br />
Slovenia 95 (1.4) 3 (2.6) 71 (2.9) 0 (4.7) 96 (1.6) 3 (2.6)<br />
South Africa 85 (1.8) ◊ ◊ 75 (2.6) ◊ ◊ 91 (1.6) ◊ ◊<br />
Spain 91 (2.1) ◊ ◊ 59 (4.2) ◊ ◊ 99 (0.7) ◊ ◊<br />
Sweden 65 (3.8) –1 (5.1) 40 (4.5) –4 (6.0) 78 (2.9) 0 (3.9)<br />
Trinidad <strong>and</strong> Tobago 95 (2.0) ◊ ◊ 74 (3.7) ◊ ◊ 99 (1.1) ◊ ◊<br />
United States 93 (2.1) –3 (2.8) 82 (2.8) 12 (4.9) h 98 (1.0) 0 (1.5)<br />
International Avg. 89 (0.4) 68 (0.5) 89 (0.3)<br />
* “Write something in response to their reading” is a combination of the teacher’s<br />
responses to the following about activities after instruction: answer reading<br />
comprehension questions in a workbook or on a worksheet about what they have<br />
read; <strong>and</strong> write something about or in response to what they have read.<br />
( ) St<strong>and</strong>ard errors appear in parentheses. Because results are rounded to the nearest<br />
whole number, some totals may appear inconsistent.<br />
h Percent in 2006 significantly higher<br />
i Percent in 2006 significantly lower<br />
An “r” indicates data are available for 70–84% of the students. An “s” indicates data are<br />
available for 50–69% of the students. An “x” indicates data are available for less than<br />
50% of the students.<br />
A diamond (◊) indicates the country did not participate in the 2001 assessment.<br />
NOTE: The International Average does not include the results from the Canadian provinces.<br />
Trend Note: The primary education systems of the Russian Federation <strong>and</strong> Slovenia<br />
underwent structural changes. Data for Canada, Ontario include only public schools.<br />
SOURCE: IEA Progress in International Reading Literacy Study (<strong>PIRLS</strong>) 2006


