

here - TIMSS and PIRLS Home - Boston College
here - TIMSS and PIRLS Home - Boston College
here - TIMSS and PIRLS Home - Boston College

You also want an ePaper? Increase the reach of your titles
YUMPU automatically turns print PDFs into web optimized ePapers that Google loves.
chapter 7: school contexts<br />
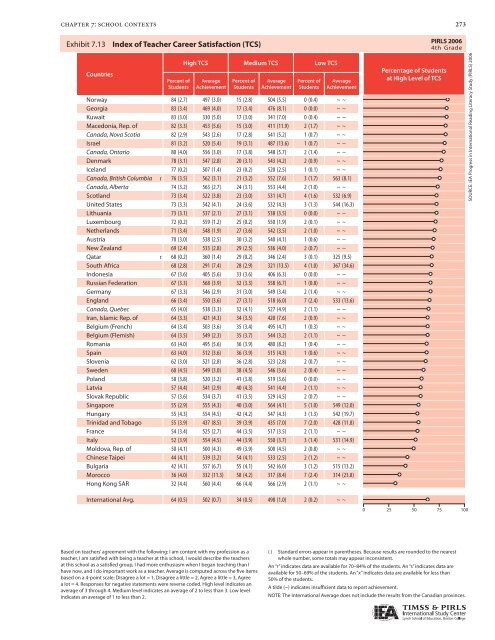
Exhibit Exhibit 7.137.13: Index Index of Teacher of Teacher Career Career Satisfaction (TCS) (TCS)<br />
Countries<br />
Percent of<br />
Students<br />
High TCS Medium TCS Low TCS<br />
Average<br />
Achievement<br />
Percent of<br />
Students<br />
Average<br />
Achievement<br />
Percent of<br />
Students<br />
Average<br />
Achievement<br />
Norway 84 (2.7) 497 (3.0) 15 (2.8) 504 (5.5) 0 (0.4) ~ ~<br />
Georgia 83 (3.4) 469 (4.0) 17 (3.4) 476 (8.1) 0 (0.0) ~ ~<br />
Kuwait 83 (3.0) 330 (5.0) 17 (3.0) 341 (7.0) 0 (0.4) ~ ~<br />
Macedonia, Rep. of 82 (3.3) 453 (5.6) 15 (3.0) 411 (11.9) 2 (1.7) ~ ~<br />
Canada, Nova Scotia 82 (2.9) 543 (2.6) 17 (2.8) 541 (5.2) 1 (0.7) ~ ~<br />
Israel 81 (3.2) 520 (5.4) 19 (3.1) 487 (13.6) 1 (0.7) ~ ~<br />
Canada, Ontario 80 (4.0) 556 (3.0) 17 (3.8) 548 (5.7) 2 (1.4) ~ ~<br />
Denmark 78 (3.1) 547 (2.8) 20 (3.1) 543 (4.2) 2 (0.9) ~ ~<br />
Icel<strong>and</strong> 77 (0.2) 507 (1.4) 23 (0.2) 520 (2.5) 1 (0.1) ~ ~<br />
Canada, British Columbia r 76 (3.5) 562 (3.1) 21 (3.2) 552 (7.6) 3 (1.7) 563 (8.1)<br />
Canada, Alberta 74 (3.2) 563 (2.7) 24 (3.1) 553 (4.4) 2 (1.0) ~ ~<br />
Scotl<strong>and</strong> 73 (3.4) 522 (3.8) 23 (3.0) 531 (4.7) 4 (1.6) 532 (6.9)<br />
United States 73 (3.3) 542 (4.1) 24 (3.6) 532 (4.3) 3 (1.3) 544 (16.3)<br />
Lithuania 73 (3.1) 537 (2.1) 27 (3.1) 538 (3.5) 0 (0.0) ~ ~<br />
Luxembourg 72 (0.2) 559 (1.2) 25 (0.2) 550 (1.9) 2 (0.1) ~ ~<br />
Netherl<strong>and</strong>s 71 (3.4) 548 (1.9) 27 (3.6) 542 (3.5) 2 (1.0) ~ ~<br />
Austria 70 (3.0) 538 (2.5) 30 (3.2) 540 (4.1) 1 (0.6) ~ ~<br />
New Zeal<strong>and</strong> 69 (2.4) 533 (2.8) 29 (2.5) 536 (4.0) 2 (0.7) ~ ~<br />
Qatar r 68 (0.2) 360 (1.4) 29 (0.2) 346 (2.4) 3 (0.1) 325 (9.5)<br />
South Africa 68 (2.8) 291 (7.4) 28 (2.9) 321 (13.5) 4 (1.0) 367 (34.6)<br />
Indonesia 67 (3.6) 405 (5.6) 33 (3.6) 406 (6.3) 0 (0.0) ~ ~<br />
Russian Federation 67 (3.3) 568 (3.9) 32 (3.3) 558 (6.7) 1 (0.8) ~ ~<br />
Germany 67 (3.3) 546 (2.9) 31 (3.0) 549 (3.4) 2 (1.4) ~ ~<br />
Engl<strong>and</strong> 66 (3.4) 550 (3.6) 27 (3.1) 518 (6.0) 7 (2.4) 533 (13.6)<br />
Canada, Quebec 65 (4.0) 538 (3.3) 32 (4.1) 527 (4.9) 2 (1.1) ~ ~<br />
Iran, Islamic Rep. of 64 (3.3) 421 (4.3) 34 (3.5) 420 (7.6) 2 (0.9) ~ ~<br />
Belgium (French) 64 (3.4) 503 (3.6) 35 (3.4) 495 (4.7) 1 (0.3) ~ ~<br />
Belgium (Flemish) 64 (3.5) 549 (2.3) 35 (3.7) 544 (3.2) 2 (1.1) ~ ~<br />
Romania 63 (4.0) 495 (5.6) 36 (3.9) 480 (8.2) 1 (0.4) ~ ~<br />
Spain 63 (4.0) 512 (3.6) 36 (3.9) 515 (4.3) 1 (0.6) ~ ~<br />
Slovenia 62 (3.0) 521 (2.8) 36 (2.8) 523 (2.8) 2 (0.7) ~ ~<br />
Sweden 60 (4.5) 549 (3.0) 38 (4.5) 546 (3.6) 2 (0.4) ~ ~<br />
Pol<strong>and</strong> 58 (3.8) 520 (3.2) 41 (3.8) 519 (3.6) 0 (0.0) ~ ~<br />
Latvia 57 (4.4) 541 (2.9) 40 (4.3) 541 (4.4) 2 (1.1) ~ ~<br />
Slovak Republic 57 (3.6) 534 (3.7) 41 (3.5) 529 (4.5) 2 (0.7) ~ ~<br />
Singapore 55 (2.9) 555 (4.3) 40 (3.0) 564 (4.1) 5 (1.0) 549 (12.0)<br />
Hungary 55 (4.3) 554 (4.5) 42 (4.2) 547 (4.3) 3 (1.3) 542 (19.7)<br />
Trinidad <strong>and</strong> Tobago 55 (3.9) 437 (8.5) 39 (3.9) 435 (7.0) 7 (2.0) 428 (11.8)<br />
France 54 (3.4) 525 (2.7) 44 (3.5) 517 (3.5) 2 (1.1) ~ ~<br />
Italy 52 (3.9) 554 (4.5) 44 (3.9) 550 (3.7) 3 (1.4) 531 (14.9)<br />
Moldova, Rep. of 50 (4.1) 500 (4.3) 49 (3.9) 500 (4.5) 2 (0.8) ~ ~<br />
Chinese Taipei 44 (4.1) 539 (3.2) 54 (4.1) 533 (2.5) 2 (1.2) ~ ~<br />
Bulgaria 42 (4.1) 557 (6.7) 55 (4.1) 542 (6.0) 3 (1.2) 515 (13.2)<br />
Morocco 36 (4.0) 332 (11.3) 58 (4.2) 317 (8.4) 7 (2.4) 314 (23.8)<br />
Hong Kong SAR 32 (4.4) 560 (4.4) 66 (4.4) 566 (2.9) 2 (1.1) ~ ~<br />
International Avg. 64 (0.5) 502 (0.7) 34 (0.5) 498 (1.0) 2 (0.2) ~ ~<br />
Based on teachers’ agreement with the following: I am content with my profession as a<br />
teacher, I am satisfied with being a teacher at this school, I would describe the teachers<br />
at this school as a satisfied group, I had more enthusiasm when I began teaching than I<br />
have now, <strong>and</strong> I do important work as a teacher. Average is computed across the five items<br />
based on a 4-point scale: Disagree a lot = 1, Disagree a little = 2, Agree a little = 3, Agree<br />
a lot = 4. Responses for negative statements were reverse coded. High level indicates an<br />
average of 3 through 4. Medium level indicates an average of 2 to less than 3. Low level<br />
indicates an average of 1 to less than 2.<br />
Percentage of Students<br />
at High Level of TCS<br />
( ) St<strong>and</strong>ard errors appear in parentheses. Because results are rounded to the nearest<br />
whole number, some totals may appear inconsistent.<br />
An “r” indicates data are available for 70–84% of the students. An “s” indicates data are<br />
available for 50–69% of the students. An “x” indicates data are available for less than<br />
50% of the students.<br />
A tilde (~) indicates insufficient data to report achievement.<br />
273<br />
<strong>PIRLS</strong> 2006<br />
4th Grade<br />
0 25 50 75 100<br />
NOTE: The International Average does not include the results from the Canadian provinces.<br />
SOURCE: IEA Progress in International Reading Literacy Study (<strong>PIRLS</strong>) 2006


