

here - TIMSS and PIRLS Home - Boston College
here - TIMSS and PIRLS Home - Boston College
here - TIMSS and PIRLS Home - Boston College

You also want an ePaper? Increase the reach of your titles
YUMPU automatically turns print PDFs into web optimized ePapers that Google loves.
chapter 7: school contexts<br />
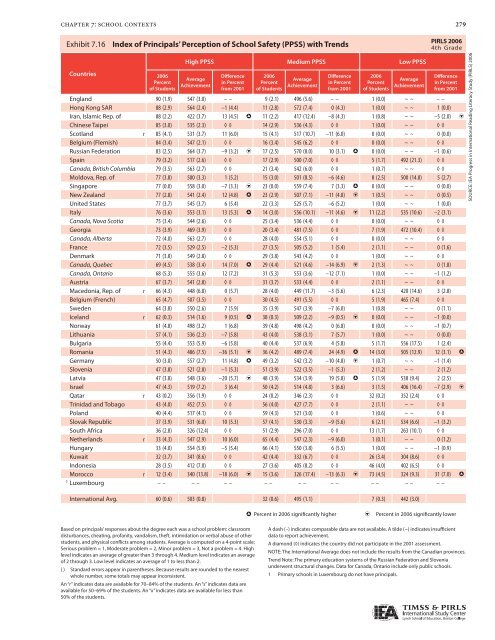
Exhibit 7.16: 7.16 Index of of Principals’ Perception of of School Safety (PPSS) with Trends<br />
Countries<br />
2006<br />
Percent<br />
of Students<br />
High PPSS Medium PPSS Low PPSS<br />
Average<br />
Achievement<br />
Difference<br />
in Percent<br />
from 2001<br />
2006<br />
Percent<br />
of Students<br />
Average<br />
Achievement<br />
Difference<br />
in Percent<br />
from 2001<br />
2006<br />
Percent<br />
of Students<br />
Average<br />
Achievement<br />
Difference<br />
in Percent<br />
from 2001<br />
Engl<strong>and</strong> 90 (1.9) 547 (3.0) – – 9 (2.1) 496 (5.6) – – 1 (0.0) ~ ~ – –<br />
Hong Kong SAR 88 (2.9) 564 (2.4) –1 (4.4) 11 (2.8) 572 (7.4) 0 (4.3) 1 (0.0) ~ ~ 1 (0.0)<br />
Iran, Islamic Rep. of 88 (2.2) 422 (3.7) 13 (4.5) h 11 (2.2) 417 (12.4) –8 (4.3) 1 (0.8) ~ ~ –5 (2.0) i<br />
Chinese Taipei 85 (3.0) 535 (2.3) ◊ ◊ 14 (2.9) 536 (4.3) ◊ ◊ 1 (0.0) ~ ~ ◊ ◊<br />
Scotl<strong>and</strong> r 85 (4.1) 531 (3.7) 11 (6.0) 15 (4.1) 517 (10.7) –11 (6.0) 0 (0.0) ~ ~ 0 (0.0)<br />
Belgium (Flemish) 84 (3.4) 547 (2.1) ◊ ◊ 16 (3.4) 545 (6.2) ◊ ◊ 0 (0.0) ~ ~ ◊ ◊<br />
Russian Federation 83 (2.5) 564 (3.7) –9 (3.2) i 17 (2.5) 570 (8.0) 10 (3.1) h 0 (0.0) ~ ~ –1 (0.6)<br />
Spain 79 (3.2) 517 (2.6) ◊ ◊ 17 (2.9) 500 (7.0) ◊ ◊ 5 (1.7) 492 (21.3) ◊ ◊<br />
Canada, British Columbia 79 (3.5) 563 (2.7) ◊ ◊ 21 (3.4) 542 (6.0) ◊ ◊ 1 (0.7) ~ ~ ◊ ◊<br />
Moldova, Rep. of 77 (3.8) 500 (3.3) 1 (5.2) 15 (3.0) 501 (8.5) –6 (4.6) 8 (2.5) 500 (14.8) 5 (2.7)<br />
Singapore 77 (0.0) 558 (3.0) –7 (3.3) i 23 (0.0) 559 (7.4) 7 (3.3) h 0 (0.0) ~ ~ 0 (0.0)<br />
New Zeal<strong>and</strong> 77 (2.8) 541 (2.4) 12 (4.8) h 23 (2.9) 507 (7.1) –11 (4.8) i 1 (0.5) ~ ~ 0 (0.5)<br />
United States 77 (3.7) 545 (3.7) 6 (5.4) 22 (3.3) 525 (5.7) –6 (5.2) 1 (0.0) ~ ~ 1 (0.0)<br />
Italy 76 (3.6) 553 (3.1) 13 (5.3) h 14 (3.0) 556 (10.1) –11 (4.6) i 11 (2.2) 535 (10.6) –2 (3.1)<br />
Canada, Nova Scotia 75 (3.4) 544 (2.6) ◊ ◊ 25 (3.4) 536 (4.4) ◊ ◊ 0 (0.0) ~ ~ ◊ ◊<br />
Georgia 73 (3.9) 469 (3.9) ◊ ◊ 20 (3.4) 481 (7.5) ◊ ◊ 7 (1.9) 472 (10.4) ◊ ◊<br />
Canada, Alberta 72 (4.0) 563 (2.7) ◊ ◊ 28 (4.0) 554 (5.1) ◊ ◊ 0 (0.0) ~ ~ ◊ ◊<br />
France 72 (3.5) 529 (2.5) –2 (5.3) 27 (3.5) 505 (5.2) 1 (5.4) 2 (1.1) ~ ~ 0 (1.6)<br />
Denmark 71 (3.8) 549 (2.8) ◊ ◊ 29 (3.8) 543 (4.2) ◊ ◊ 1 (0.0) ~ ~ ◊ ◊<br />
Canada, Quebec 69 (4.5) 538 (3.4) 14 (7.0) h 29 (4.4) 521 (4.6) –14 (6.9) i 2 (1.3) ~ ~ 0 (1.8)<br />
Canada, Ontario 68 (5.3) 555 (3.6) 12 (7.2) 31 (5.3) 553 (3.6) –12 (7.1) 1 (0.0) ~ ~ –1 (1.2)<br />
Austria 67 (3.7) 541 (2.8) ◊ ◊ 31 (3.7) 533 (4.4) ◊ ◊ 2 (1.1) ~ ~ ◊ ◊<br />
Macedonia, Rep. of r 66 (4.3) 448 (6.8) 0 (5.7) 28 (4.0) 449 (11.7) –3 (5.6) 6 (2.3) 420 (14.6) 3 (2.8)<br />
Belgium (French) 65 (4.7) 507 (3.5) ◊ ◊ 30 (4.5) 491 (5.5) ◊ ◊ 5 (1.9) 465 (7.4) ◊ ◊<br />
Sweden 64 (3.8) 550 (2.6) 7 (5.9) 35 (3.9) 547 (3.9) –7 (6.0) 1 (0.8) ~ ~ 0 (1.1)<br />
Icel<strong>and</strong> r 62 (0.3) 514 (1.6) 9 (0.5) h 38 (0.3) 509 (2.2) –9 (0.5) i 0 (0.0) ~ ~ –1 (0.0)<br />
Norway 61 (4.8) 498 (3.2) 1 (6.8) 39 (4.8) 498 (4.2) 0 (6.8) 0 (0.0) ~ ~ –1 (0.7)<br />
Lithuania 57 (4.1) 536 (2.3) –7 (5.8) 43 (4.0) 538 (3.1) 7 (5.7) 1 (0.0) ~ ~ 0 (0.0)<br />
Bulgaria 55 (4.4) 553 (5.9) –6 (5.8) 40 (4.4) 537 (6.9) 4 (5.8) 5 (1.7) 556 (17.5) 1 (2.4)<br />
Romania 51 (4.3) 486 (7.5) –36 (5.1) i 36 (4.2) 489 (7.4) 24 (4.9) h 14 (3.0) 505 (12.9) 12 (3.1) h<br />
Germany 50 (3.0) 557 (2.7) 11 (4.8) h 49 (3.2) 542 (3.2) –10 (4.8) i 1 (0.7) ~ ~ –1 (1.4)<br />
Slovenia 47 (3.8) 521 (2.8) –1 (5.3) 51 (3.9) 522 (3.5) –1 (5.3) 2 (1.2) ~ ~ 2 (1.2)<br />
Latvia 47 (3.8) 548 (3.6) –20 (5.7) i 48 (3.9) 534 (3.9) 19 (5.8) h 5 (1.9) 538 (9.4) 2 (2.5)<br />
Israel 47 (4.3) 519 (7.2) 3 (6.4) 50 (4.2) 514 (4.8) 3 (6.6) 3 (1.5) 406 (16.4) –7 (2.9) i<br />
Qatar r 43 (0.2) 356 (1.9) ◊ ◊ 24 (0.2) 346 (2.3) ◊ ◊ 32 (0.2) 352 (2.4) ◊ ◊<br />
Trinidad <strong>and</strong> Tobago 43 (4.0) 452 (7.5) ◊ ◊ 56 (4.0) 427 (7.7) ◊ ◊ 2 (1.1) ~ ~ ◊ ◊<br />
Pol<strong>and</strong> 40 (4.4) 517 (4.1) ◊ ◊ 59 (4.3) 521 (3.0) ◊ ◊ 1 (0.6) ~ ~ ◊ ◊<br />
Slovak Republic 37 (3.9) 531 (6.0) 10 (5.3) 57 (4.1) 530 (3.3) –9 (5.6) 6 (2.1) 534 (6.6) –1 (3.2)<br />
South Africa 36 (2.8) 326 (12.4) ◊ ◊ 51 (2.9) 296 (7.0) ◊ ◊ 13 (1.7) 263 (10.1) ◊ ◊<br />
Netherl<strong>and</strong>s r 33 (4.3) 547 (2.9) 10 (6.0) 65 (4.4) 547 (2.3) –9 (6.0) 1 (0.1) ~ ~ 0 (1.2)<br />
Hungary 33 (4.0) 554 (5.9) –5 (5.4) 66 (4.1) 550 (3.8) 6 (5.5) 1 (0.0) ~ ~ –1 (0.9)<br />
Kuwait 32 (3.7) 341 (8.6) ◊ ◊ 42 (4.4) 332 (6.7) ◊ ◊ 26 (3.4) 304 (8.6) ◊ ◊<br />
Indonesia 28 (3.5) 412 (7.0) ◊ ◊ 27 (3.6) 405 (8.2) ◊ ◊ 46 (4.0) 402 (6.5) ◊ ◊<br />
Morocco r 12 (3.4) 340 (13.8) –18 (6.0) i 15 (3.6) 326 (17.4) –13 (6.3) i 73 (4.5) 324 (9.3) 31 (7.0) h<br />
1 Luxembourg – – – – – – – – – – – – – – – – – –<br />
International Avg. 60 (0.6) 503 (0.8) 32 (0.6) 495 (1.1) 7 (0.3) 442 (3.0)<br />
Based on principals’ responses about the degree each was a school problem: classroom<br />
disturbances, cheating, profanity, v<strong>and</strong>alism, theft, intimidation or verbal abuse of other<br />
students, <strong>and</strong> physical conflicts among students. Average is computed on a 4-point scale;<br />
Serious problem = 1, Moderate problem = 2, Minor problem = 3, Not a problem = 4. High<br />
level indicates an average of greater than 3 through 4. Medium level indicates an average<br />
of 2 through 3. Low level indicates an average of 1 to less than 2.<br />
( ) St<strong>and</strong>ard errors appear in parentheses. Because results are rounded to the nearest<br />
whole number, some totals may appear inconsistent.<br />
An “r” indicates data are available for 70–84% of the students. An “s” indicates data are<br />
available for 50–69% of the students. An “x” indicates data are available for less than<br />
50% of the students.<br />
h Percent in 2006 significantly higher i Percent in 2006 significantly lower<br />
A dash (–) indicates comparable data are not available. A tilde (~) indicates insufficient<br />
data to report achievement.<br />
A diamond (◊) indicates the country did not participate in the 2001 assessment.<br />
279<br />
NOTE: The International Average does not include the results from the Canadian provinces.<br />
Trend Note: The primary education systems of the Russian Federation <strong>and</strong> Slovenia<br />
underwent structural changes. Data for Canada, Ontario include only public schools.<br />
1 Primary schools in Luxembourg do not have principals.<br />
<strong>PIRLS</strong> 2006<br />
4th Grade<br />
SOURCE: IEA Progress in International Reading Literacy Study (<strong>PIRLS</strong>) 2006


