

here - TIMSS and PIRLS Home - Boston College
here - TIMSS and PIRLS Home - Boston College
here - TIMSS and PIRLS Home - Boston College

You also want an ePaper? Increase the reach of your titles
YUMPU automatically turns print PDFs into web optimized ePapers that Google loves.
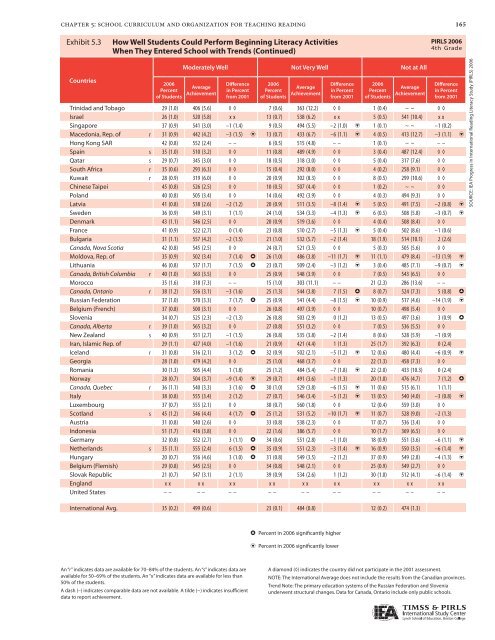
chapter 5: school curriculum <strong>and</strong> organization for teaching reading<br />
Exhibit 5.3: 5.3 How How Well Well Students Could Could Do Perform Decoding Beginning Early Literacy Activities Beginning School<br />
with Trends (Continued)<br />
When They Entered School with Trends (Continued)<br />
Countries<br />
2006<br />
Percent<br />
of Students<br />
Moderately Well Not Very Well Not at All<br />
Average<br />
Achievement<br />
Difference<br />
in Percent<br />
from 2001<br />
2006<br />
Percent<br />
of Students<br />
Average<br />
Achievement<br />
Difference<br />
in Percent<br />
from 2001<br />
2006<br />
Percent<br />
of Students<br />
Average<br />
Achievement<br />
Difference<br />
in Percent<br />
from 2001<br />
Trinidad <strong>and</strong> Tobago 29 (1.0) 406 (5.6) ◊ ◊ 7 (0.6) 363 (12.2) ◊ ◊ 1 (0.4) ~ ~ ◊ ◊<br />
Israel 26 (1.0) 520 (5.8) x x 13 (0.7) 538 (6.2) x x 5 (0.5) 541 (10.4) x x<br />
Singapore 37 (0.9) 541 (3.0) –1 (1.4) 9 (0.5) 494 (5.5) –2 (1.0) i 1 (0.1) ~ ~ –1 (0.2)<br />
Macedonia, Rep. of r 31 (0.9) 442 (4.2) –3 (1.5) i 13 (0.7) 433 (6.7) –6 (1.1) i 4 (0.5) 413 (12.7) –3 (1.1) i<br />
Hong Kong SAR 42 (0.8) 552 (2.4) – – 6 (0.5) 515 (4.8) – – 1 (0.1) ~ ~ – –<br />
Spain s 35 (1.0) 510 (3.2) ◊ ◊ 11 (0.8) 489 (4.9) ◊ ◊ 3 (0.4) 487 (12.4) ◊ ◊<br />
Qatar s 29 (0.7) 345 (3.0) ◊ ◊ 18 (0.5) 318 (3.0) ◊ ◊ 5 (0.4) 317 (7.6) ◊ ◊<br />
South Africa r 35 (0.6) 293 (6.3) ◊ ◊ 15 (0.4) 292 (8.0) ◊ ◊ 4 (0.2) 258 (9.1) ◊ ◊<br />
Kuwait r 28 (0.9) 319 (6.0) ◊ ◊ 20 (0.9) 302 (8.3) ◊ ◊ 8 (0.5) 299 (10.6) ◊ ◊<br />
Chinese Taipei 45 (0.8) 526 (2.5) ◊ ◊ 10 (0.5) 507 (4.4) ◊ ◊ 1 (0.2) ~ ~ ◊ ◊<br />
Pol<strong>and</strong> 40 (0.8) 505 (3.4) ◊ ◊ 14 (0.6) 492 (3.9) ◊ ◊ 4 (0.3) 494 (9.3) ◊ ◊<br />
Latvia 41 (0.8) 538 (2.6) –2 (1.2) 20 (0.9) 511 (3.5) –8 (1.4) i 5 (0.5) 491 (7.5) –2 (0.8) i<br />
Sweden 36 (0.9) 549 (3.1) 1 (1.1) 24 (1.0) 534 (3.3) –4 (1.3) i 6 (0.5) 508 (5.8) –3 (0.7) i<br />
Denmark 43 (1.1) 546 (2.5) ◊ ◊ 20 (0.9) 519 (3.6) ◊ ◊ 4 (0.4) 508 (8.4) ◊ ◊<br />
France 41 (0.9) 522 (2.7) 0 (1.4) 23 (0.8) 510 (2.7) –5 (1.3) i 5 (0.4) 502 (8.6) –1 (0.6)<br />
Bulgaria 31 (1.1) 557 (4.2) –2 (1.5) 21 (1.0) 532 (5.7) –2 (1.4) 18 (1.9) 514 (10.1) 2 (2.6)<br />
Canada, Nova Scotia 42 (0.8) 545 (2.5) ◊ ◊ 24 (0.7) 521 (3.5) ◊ ◊ 5 (0.3) 505 (5.6) ◊ ◊<br />
Moldova, Rep. of 35 (0.9) 502 (3.4) 7 (1.4) h 26 (1.0) 486 (3.8) –11 (1.7) i 11 (1.1) 479 (8.4) –13 (1.9) i<br />
Lithuania 46 (0.8) 537 (1.7) 7 (1.5) h 23 (0.7) 509 (2.4) –3 (1.2) i 3 (0.4) 485 (7.1) –9 (0.7) i<br />
Canada, British Columbia r 40 (1.0) 563 (3.5) ◊ ◊ 25 (0.9) 548 (3.9) ◊ ◊ 7 (0.5) 543 (6.5) ◊ ◊<br />
Morocco 35 (1.6) 318 (7.3) – – 15 (1.0) 303 (11.1) – – 21 (2.3) 286 (13.6) – –<br />
Canada, Ontario r 38 (1.2) 556 (3.1) –3 (1.6) 25 (1.3) 544 (3.8) 7 (1.5) h 8 (0.7) 524 (7.3) 5 (0.8) h<br />
Russian Federation 37 (1.0) 570 (3.3) 7 (1.7) h 25 (0.9) 541 (4.4) –8 (1.5) i 10 (0.9) 517 (4.6) –14 (1.9) i<br />
Belgium (French) 37 (0.8) 500 (3.1) ◊ ◊ 26 (0.8) 497 (3.9) ◊ ◊ 10 (0.7) 498 (5.4) ◊ ◊<br />
Slovenia 34 (0.7) 525 (2.3) –2 (1.3) 26 (0.8) 503 (2.9) 0 (1.2) 13 (0.5) 497 (3.6) 3 (0.9) h<br />
Canada, Alberta r 39 (1.0) 565 (3.2) ◊ ◊ 27 (0.8) 551 (3.2) ◊ ◊ 7 (0.5) 536 (5.5) ◊ ◊<br />
New Zeal<strong>and</strong> s 40 (0.9) 551 (2.7) –1 (1.5) 26 (0.8) 535 (3.8) –2 (1.4) 8 (0.6) 528 (5.9) –1 (0.9)<br />
Iran, Islamic Rep. of 29 (1.1) 427 (4.0) –1 (1.6) 21 (0.9) 421 (4.4) 1 (1.3) 25 (1.7) 392 (6.3) 0 (2.4)<br />
Icel<strong>and</strong> r 31 (0.8) 516 (2.1) 3 (1.2) h 32 (0.9) 502 (2.1) –5 (1.2) i 12 (0.6) 480 (4.4) –6 (0.9) i<br />
Georgia 28 (1.0) 479 (4.2) ◊ ◊ 25 (1.0) 468 (3.7) ◊ ◊ 22 (1.3) 458 (7.3) ◊ ◊<br />
Romania 30 (1.3) 505 (4.4) 1 (1.8) 25 (1.2) 484 (5.4) –7 (1.8) i 22 (2.0) 433 (10.3) 0 (2.4)<br />
Norway 28 (0.7) 504 (3.7) –9 (1.4) i 29 (0.7) 491 (3.6) –1 (1.3) 20 (1.0) 476 (4.7) 7 (1.2) h<br />
Canada, Quebec r 36 (1.1) 540 (3.3) 3 (1.6) h 30 (1.0) 529 (3.8) –6 (1.5) i 11 (0.6) 515 (6.1) 1 (1.1)<br />
Italy 38 (0.8) 555 (3.4) 2 (1.2) 27 (0.7) 546 (3.4) –5 (1.2) i 13 (0.5) 540 (4.0) –3 (0.8) i<br />
Luxembourg 37 (0.7) 555 (2.1) ◊ ◊ 30 (0.7) 560 (1.8) ◊ ◊ 12 (0.4) 559 (3.0) ◊ ◊<br />
Scotl<strong>and</strong> s 45 (1.2) 546 (4.4) 4 (1.7) h 25 (1.2) 531 (5.2) –10 (1.7) i 11 (0.7) 528 (9.0) –2 (1.3)<br />
Austria 31 (0.8) 540 (2.6) ◊ ◊ 33 (0.8) 538 (2.3) ◊ ◊ 17 (0.7) 536 (3.4) ◊ ◊<br />
Indonesia 51 (1.7) 416 (3.8) ◊ ◊ 22 (1.6) 386 (5.7) ◊ ◊ 10 (1.7) 369 (6.5) ◊ ◊<br />
Germany 32 (0.8) 552 (2.7) 3 (1.1) h 34 (0.6) 551 (2.8) –1 (1.0) 18 (0.9) 551 (3.6) –6 (1.1) i<br />
Netherl<strong>and</strong>s s 35 (1.1) 555 (2.4) 6 (1.5) h 35 (0.9) 551 (2.3) –3 (1.4) i 16 (0.9) 550 (3.5) –6 (1.4) i<br />
Hungary 20 (0.7) 556 (4.6) 3 (1.0) h 31 (0.8) 549 (3.5) –2 (1.2) 37 (0.9) 549 (2.8) –4 (1.3) i<br />
Belgium (Flemish) 29 (0.8) 545 (2.5) ◊ ◊ 34 (0.8) 548 (2.1) ◊ ◊ 25 (0.9) 549 (2.7) ◊ ◊<br />
Slovak Republic 21 (0.7) 547 (3.1) 2 (1.1) 39 (0.9) 534 (2.6) 1 (1.2) 30 (1.0) 512 (4.1) –6 (1.4) i<br />
Engl<strong>and</strong> x x x x x x x x x x x x x x x x x x<br />
United States – – – – – – – – – – – – – – – – – –<br />
International Avg. 35 (0.2) 499 (0.6) 23 (0.1) 484 (0.8) 12 (0.2) 474 (1.3)<br />
An “r” indicates data are available for 70–84% of the students. An “s” indicates data are<br />
available for 50–69% of the students. An “x” indicates data are available for less than<br />
50% of the students.<br />
A dash (–) indicates comparable data are not available. A tilde (~) indicates insufficient<br />
data to report achievement.<br />
h Percent in 2006 significantly higher<br />
i Percent in 2006 significantly lower<br />
A diamond (◊) indicates the country did not participate in the 2001 assessment.<br />
165<br />
<strong>PIRLS</strong> 2006<br />
4th Grade<br />
NOTE: The International Average does not include the results from the Canadian provinces.<br />
Trend Note: The primary education systems of the Russian Federation <strong>and</strong> Slovenia<br />
underwent structural changes. Data for Canada, Ontario include only public schools.<br />
SOURCE: IEA Progress in International Reading Literacy Study (<strong>PIRLS</strong>) 2006


