

here - TIMSS and PIRLS Home - Boston College
here - TIMSS and PIRLS Home - Boston College
here - TIMSS and PIRLS Home - Boston College

You also want an ePaper? Increase the reach of your titles
YUMPU automatically turns print PDFs into web optimized ePapers that Google loves.
chapter 7: school contexts<br />
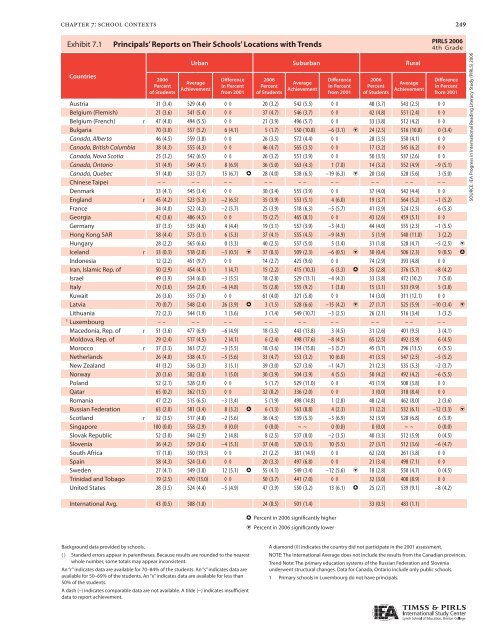
Exhibit 7.1: 7.1 Principals’ Reports on on Their Their Schools’ Locations with with Trends<br />
Countries<br />
2006<br />
Percent<br />
of Students<br />
Urban Suburban Rural<br />
Average<br />
Achievement<br />
Difference<br />
in Percent<br />
from 2001<br />
2006<br />
Percent<br />
of Students<br />
Average<br />
Achievement<br />
Difference<br />
in Percent<br />
from 2001<br />
2006<br />
Percent<br />
of Students<br />
Average<br />
Achievement<br />
Difference<br />
in Percent<br />
from 2001<br />
Austria 31 (3.4) 529 (4.4) ◊ ◊ 20 (3.2) 542 (5.5) ◊ ◊ 48 (3.7) 543 (2.5) ◊ ◊<br />
Belgium (Flemish) 21 (3.6) 541 (5.4) ◊ ◊ 37 (4.7) 546 (3.7) ◊ ◊ 42 (4.8) 551 (2.4) ◊ ◊<br />
Belgium (French) r 47 (4.0) 494 (5.5) ◊ ◊ 21 (3.9) 496 (5.7) ◊ ◊ 33 (3.8) 512 (4.2) ◊ ◊<br />
Bulgaria 70 (3.0) 557 (5.2) 6 (4.1) 5 (1.7) 550 (10.8) –6 (3.1) i 24 (2.5) 516 (10.8) 0 (3.4)<br />
Canada, Alberta 46 (4.5) 559 (3.8) ◊ ◊ 26 (3.5) 572 (4.4) ◊ ◊ 28 (3.5) 550 (4.1) ◊ ◊<br />
Canada, British Columbia 38 (4.3) 555 (4.3) ◊ ◊ 46 (4.7) 565 (3.5) ◊ ◊ 17 (3.2) 545 (6.2) ◊ ◊<br />
Canada, Nova Scotia 25 (3.2) 542 (6.5) ◊ ◊ 26 (3.2) 551 (3.9) ◊ ◊ 50 (3.5) 537 (2.6) ◊ ◊<br />
Canada, Ontario 51 (4.9) 549 (4.1) 8 (6.9) 36 (5.0) 563 (4.3) 1 (7.0) 14 (3.2) 552 (4.9) –9 (5.1)<br />
Canada, Quebec 51 (4.8) 533 (3.7) 15 (6.7) h 28 (4.0) 538 (6.5) –19 (6.3) i 20 (3.6) 528 (5.6) 3 (5.0)<br />
Chinese Taipei – – – – – – – – – – – – – – – – – –<br />
Denmark 33 (4.1) 545 (3.4) ◊ ◊ 30 (3.4) 555 (3.9) ◊ ◊ 37 (4.0) 542 (4.4) ◊ ◊<br />
Engl<strong>and</strong> r 45 (4.2) 523 (5.3) –2 (6.5) 35 (3.9) 553 (5.1) 4 (6.0) 19 (3.7) 564 (5.2) –1 (5.2)<br />
France 34 (4.0) 522 (4.3) –2 (5.7) 25 (3.9) 518 (6.3) –5 (5.7) 41 (3.9) 524 (2.5) 6 (5.3)<br />
Georgia 42 (3.6) 486 (4.5) ◊ ◊ 15 (2.7) 465 (8.1) ◊ ◊ 43 (2.6) 459 (5.1) ◊ ◊<br />
Germany 37 (3.3) 535 (4.6) 4 (4.4) 19 (3.1) 557 (3.9) –3 (4.3) 44 (4.0) 555 (2.3) –1 (5.5)<br />
Hong Kong SAR 58 (4.4) 573 (3.1) 6 (5.3) 37 (4.1) 555 (4.5) –9 (4.9) 5 (1.9) 540 (11.0) 3 (2.2)<br />
Hungary 28 (2.2) 565 (6.6) 0 (3.3) 40 (2.5) 557 (5.0) 5 (3.4) 31 (1.8) 528 (4.7) –5 (2.5) i<br />
Icel<strong>and</strong> r 33 (0.3) 518 (2.0) –3 (0.5) i 37 (0.3) 509 (2.3) –6 (0.5) i 30 (0.4) 506 (2.3) 9 (0.5) h<br />
Indonesia 12 (2.2) 451 (9.7) ◊ ◊ 14 (2.7) 425 (9.6) ◊ ◊ 74 (2.9) 393 (4.8) ◊ ◊<br />
Iran, Islamic Rep. of 50 (2.9) 454 (4.1) 1 (4.7) 15 (2.2) 415 (10.3) 6 (3.3) h 35 (2.8) 376 (5.7) –8 (4.2)<br />
Israel 49 (3.9) 534 (6.0) –3 (5.5) 18 (2.8) 529 (13.1) –4 (4.3) 33 (3.8) 472 (10.2) 7 (5.0)<br />
Italy 70 (3.6) 554 (2.9) –6 (4.8) 15 (2.8) 555 (9.2) 1 (3.8) 15 (3.1) 533 (9.9) 5 (3.8)<br />
Kuwait 26 (3.6) 355 (7.6) ◊ ◊ 61 (4.0) 321 (5.8) ◊ ◊ 14 (3.0) 311 (12.1) ◊ ◊<br />
Latvia 70 (0.7) 548 (2.4) 26 (3.9) h 3 (1.5) 528 (6.6) –15 (4.2) i 27 (1.7) 525 (5.9) –10 (3.4) i<br />
Lithuania 72 (2.3) 544 (1.9) 1 (3.6) 3 (1.4) 549 (10.7) –3 (2.5) 26 (2.1) 516 (3.4) 3 (3.2)<br />
1 Luxembourg – – – – – – – – – – – – – – – – – –<br />
Macedonia, Rep. of r 51 (3.6) 477 (6.9) –6 (4.9) 18 (3.5) 443 (13.8) 3 (4.5) 31 (2.6) 401 (9.5) 3 (4.1)<br />
Moldova, Rep. of 29 (2.4) 517 (4.5) 2 (4.1) 6 (2.4) 498 (17.6) –8 (4.5) 65 (2.5) 492 (3.9) 6 (4.5)<br />
Morocco r 37 (3.3) 363 (7.2) –3 (5.5) 18 (3.6) 334 (15.8) –3 (5.7) 45 (3.7) 296 (13.5) 6 (5.5)<br />
Netherl<strong>and</strong>s 26 (4.0) 538 (4.1) –5 (5.6) 33 (4.7) 553 (3.2) 10 (6.0) 41 (3.5) 547 (2.5) –5 (5.2)<br />
New Zeal<strong>and</strong> 41 (3.2) 536 (3.3) 3 (5.1) 39 (3.0) 527 (3.6) –1 (4.7) 21 (2.3) 535 (5.3) –2 (3.7)<br />
Norway 20 (3.6) 502 (3.8) 1 (5.0) 30 (3.9) 504 (3.9) 4 (5.5) 50 (4.2) 492 (4.2) –6 (5.5)<br />
Pol<strong>and</strong> 52 (2.1) 528 (2.9) ◊ ◊ 5 (1.7) 529 (11.0) ◊ ◊ 43 (1.9) 508 (3.8) ◊ ◊<br />
Qatar 65 (0.2) 362 (1.5) ◊ ◊ 32 (0.2) 336 (2.0) ◊ ◊ 3 (0.0) 318 (8.4) ◊ ◊<br />
Romania 47 (2.2) 515 (6.5) –3 (3.4) 5 (1.9) 498 (14.8) 1 (2.8) 48 (2.4) 462 (8.0) 2 (3.6)<br />
Russian Federation 63 (2.0) 581 (3.4) 8 (3.2) h 6 (1.3) 563 (8.8) 4 (2.3) 31 (2.2) 532 (6.1) –12 (3.3) i<br />
Scotl<strong>and</strong> r 32 (3.5) 517 (4.8) –2 (5.6) 36 (4.3) 539 (5.3) –3 (6.9) 32 (3.9) 528 (6.8) 6 (5.9)<br />
Singapore 100 (0.0) 558 (2.9) 0 (0.0) 0 (0.0) ~ ~ 0 (0.0) 0 (0.0) ~ ~ 0 (0.0)<br />
Slovak Republic 52 (3.0) 544 (2.9) 2 (4.8) 8 (2.5) 537 (8.0) –2 (3.5) 40 (3.3) 512 (5.9) 0 (4.5)<br />
Slovenia 36 (4.2) 529 (3.6) –4 (5.3) 37 (4.0) 520 (3.1) 10 (5.5) 27 (3.7) 512 (3.6) –6 (4.7)<br />
South Africa 17 (1.8) 350 (19.5) ◊ ◊ 21 (2.2) 381 (14.9) ◊ ◊ 62 (2.0) 261 (3.8) ◊ ◊<br />
Spain 58 (4.3) 524 (3.4) ◊ ◊ 20 (3.3) 497 (6.8) ◊ ◊ 21 (3.4) 498 (7.1) ◊ ◊<br />
Sweden 27 (4.1) 549 (3.8) 12 (5.1) h 55 (4.1) 549 (3.4) –12 (5.6) i 18 (2.8) 550 (4.7) 0 (4.5)<br />
Trinidad <strong>and</strong> Tobago 19 (2.5) 470 (13.0) ◊ ◊ 50 (3.7) 441 (7.0) ◊ ◊ 32 (3.0) 408 (8.9) ◊ ◊<br />
United States 28 (3.5) 524 (4.4) –5 (4.9) 47 (3.9) 550 (3.2) 13 (6.1) h 25 (2.7) 539 (9.1) –8 (4.2)<br />
International Avg. 43 (0.5) 508 (1.0) 24 (0.5) 501 (1.4) 33 (0.5) 483 (1.1)<br />
Background data provided by schools.<br />
( ) St<strong>and</strong>ard errors appear in parentheses. Because results are rounded to the nearest<br />
whole number, some totals may appear inconsistent.<br />
An “r” indicates data are available for 70–84% of the students. An “s” indicates data are<br />
available for 50–69% of the students. An “x” indicates data are available for less than<br />
50% of the students.<br />
A dash (–) indicates comparable data are not available. A tilde (~) indicates insufficient<br />
data to report achievement.<br />
h Percent in 2006 significantly higher<br />
i Percent in 2006 significantly lower<br />
A diamond (◊) indicates the country did not participate in the 2001 assessment.<br />
249<br />
NOTE: The International Average does not include the results from the Canadian provinces.<br />
Trend Note: The primary education systems of the Russian Federation <strong>and</strong> Slovenia<br />
underwent structural changes. Data for Canada, Ontario include only public schools.<br />
1 Primary schools in Luxembourg do not have principals.<br />
<strong>PIRLS</strong> 2006<br />
4th Grade<br />
SOURCE: IEA Progress in International Reading Literacy Study (<strong>PIRLS</strong>) 2006


