

here - TIMSS and PIRLS Home - Boston College
here - TIMSS and PIRLS Home - Boston College
here - TIMSS and PIRLS Home - Boston College

You also want an ePaper? Increase the reach of your titles
YUMPU automatically turns print PDFs into web optimized ePapers that Google loves.
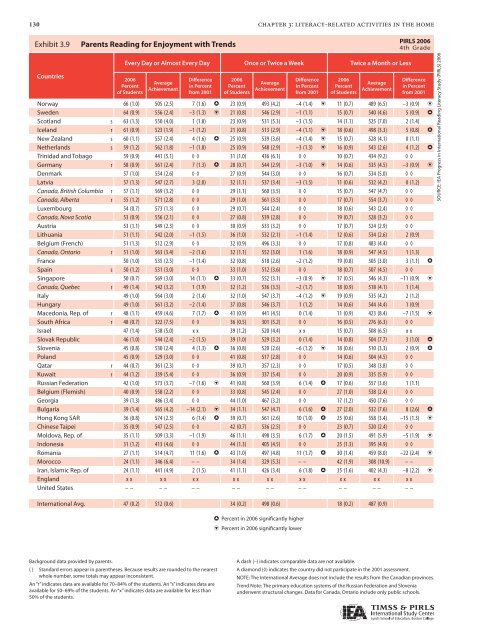
130 chapter 3: literacy-related activities in the home<br />
Exhibit 3.9: 3.9 Parents Reading for for Enjoyment with with Trends<br />
Countries<br />
Every Day or Almost Every Day Once or Twice a Week Twice a Month or Less<br />
2006<br />
Percent<br />
of Students<br />
Average<br />
Achievement<br />
Difference<br />
in Percent<br />
from 2001<br />
2006<br />
Percent<br />
of Students<br />
Average<br />
Achievement<br />
Difference<br />
in Percent<br />
from 2001<br />
2006<br />
Percent<br />
of Students<br />
Average<br />
Achievement<br />
Difference<br />
in Percent<br />
from 2001<br />
Norway 66 (1.0) 505 (2.5) 7 (1.6) h 23 (0.9) 493 (4.2) –4 (1.4) i 11 (0.7) 489 (6.5) –3 (0.9) i<br />
Sweden 64 (0.9) 556 (2.4) –3 (1.3) i 21 (0.8) 546 (2.9) –1 (1.1) 15 (0.7) 540 (4.6) 5 (0.9) h<br />
Scotl<strong>and</strong> s 63 (1.3) 550 (4.0) 1 (1.8) 23 (0.9) 531 (5.3) –3 (1.5) 14 (1.1) 525 (7.0) 2 (1.4)<br />
Icel<strong>and</strong> r 61 (0.9) 523 (1.9) –1 (1.2) 21 (0.8) 513 (2.9) –4 (1.1) i 18 (0.6) 498 (3.3) 5 (0.8) h<br />
New Zeal<strong>and</strong> s 60 (1.1) 557 (2.4) 4 (1.6) h 25 (0.9) 539 (3.6) –4 (1.4) i 15 (0.7) 528 (4.1) 0 (1.1)<br />
Netherl<strong>and</strong>s s 59 (1.2) 562 (1.8) –1 (1.8) 25 (0.9) 548 (2.9) –3 (1.3) i 16 (0.9) 543 (2.6) 4 (1.2) h<br />
Trinidad <strong>and</strong> Tobago 59 (0.9) 441 (5.1) ◊ ◊ 31 (1.0) 436 (6.1) ◊ ◊ 10 (0.7) 434 (9.2) ◊ ◊<br />
Germany r 58 (0.9) 561 (2.4) 7 (1.3) h 28 (0.7) 544 (2.9) –3 (1.0) i 14 (0.6) 535 (4.5) –3 (0.9) i<br />
Denmark 57 (1.0) 554 (2.6) ◊ ◊ 27 (0.9) 544 (3.0) ◊ ◊ 16 (0.7) 534 (5.0) ◊ ◊<br />
Latvia 57 (1.3) 547 (2.7) 3 (2.0) 32 (1.1) 537 (3.4) –3 (1.5) 11 (0.6) 532 (4.2) 0 (1.2)<br />
Canada, British Columbia r 57 (1.1) 569 (3.2) ◊ ◊ 29 (1.1) 560 (3.5) ◊ ◊ 15 (0.7) 547 (4.7) ◊ ◊<br />
Canada, Alberta r 55 (1.2) 571 (2.8) ◊ ◊ 29 (1.0) 561 (3.5) ◊ ◊ 17 (0.7) 554 (3.7) ◊ ◊<br />
Luxembourg 54 (0.7) 573 (1.3) ◊ ◊ 29 (0.7) 544 (2.4) ◊ ◊ 18 (0.6) 543 (2.4) ◊ ◊<br />
Canada, Nova Scotia 53 (0.9) 556 (2.1) ◊ ◊ 27 (0.8) 539 (2.8) ◊ ◊ 19 (0.7) 528 (3.2) ◊ ◊<br />
Austria 53 (1.1) 549 (2.3) ◊ ◊ 30 (0.9) 533 (3.2) ◊ ◊ 17 (0.7) 524 (2.9) ◊ ◊<br />
Lithuania 51 (1.1) 542 (2.0) –1 (1.5) 36 (1.0) 532 (2.1) –1 (1.4) 12 (0.6) 534 (2.6) 2 (0.9)<br />
Belgium (French) 51 (1.3) 512 (2.9) ◊ ◊ 32 (0.9) 496 (3.3) ◊ ◊ 17 (0.8) 483 (4.4) ◊ ◊<br />
Canada, Ontario r 51 (1.0) 563 (3.4) –2 (1.6) 32 (1.1) 552 (3.0) 1 (1.6) 18 (0.9) 547 (4.5) 1 (1.3)<br />
France 50 (1.0) 535 (2.5) –1 (1.4) 32 (0.8) 518 (2.6) –2 (1.2) 19 (0.8) 505 (3.0) 3 (1.1) h<br />
Spain s 50 (1.2) 531 (3.0) ◊ ◊ 33 (1.0) 512 (3.6) ◊ ◊ 18 (0.7) 507 (4.5) ◊ ◊<br />
Singapore 50 (0.7) 569 (3.0) 14 (1.1) h 33 (0.7) 552 (3.1) –3 (0.9) i 17 (0.5) 546 (4.3) –11 (0.9) i<br />
Canada, Quebec r 49 (1.4) 542 (3.2) 1 (1.9) 32 (1.2) 536 (3.5) –2 (1.7) 18 (0.9) 518 (4.1) 1 (1.4)<br />
Italy 49 (1.0) 564 (3.0) 2 (1.4) 32 (1.0) 547 (3.7) –4 (1.2) i 19 (0.9) 535 (4.2) 2 (1.2)<br />
Hungary 49 (1.0) 561 (3.2) –2 (1.4) 37 (0.8) 546 (3.7) 1 (1.2) 14 (0.6) 544 (4.4) 1 (0.9)<br />
Macedonia, Rep. of r 48 (1.1) 459 (4.6) 7 (1.7) h 41 (0.9) 441 (4.5) 0 (1.4) 11 (0.9) 423 (8.4) –7 (1.5) i<br />
South Africa r 48 (0.7) 322 (7.5) ◊ ◊ 36 (0.5) 301 (5.2) ◊ ◊ 16 (0.5) 276 (6.3) ◊ ◊<br />
Israel 47 (1.4) 538 (5.0) x x 39 (1.2) 520 (4.4) x x 15 (0.7) 508 (6.5) x x<br />
Slovak Republic 46 (1.0) 544 (2.4) –2 (1.5) 39 (1.0) 529 (3.2) 0 (1.4) 14 (0.8) 504 (7.7) 3 (1.0) h<br />
Slovenia 45 (0.8) 530 (2.4) 4 (1.3) h 36 (0.8) 520 (2.6) –6 (1.2) i 18 (0.6) 510 (3.3) 2 (0.9) h<br />
Pol<strong>and</strong> 45 (0.9) 529 (3.0) ◊ ◊ 41 (0.8) 517 (2.8) ◊ ◊ 14 (0.6) 504 (4.5) ◊ ◊<br />
Qatar r 44 (0.7) 361 (2.3) ◊ ◊ 39 (0.7) 357 (2.3) ◊ ◊ 17 (0.5) 348 (3.8) ◊ ◊<br />
Kuwait r 44 (1.2) 339 (5.4) ◊ ◊ 36 (0.9) 337 (5.4) ◊ ◊ 20 (0.9) 335 (5.9) ◊ ◊<br />
Russian Federation 42 (1.0) 573 (3.7) –7 (1.6) i 41 (0.8) 560 (3.9) 6 (1.4) h 17 (0.6) 557 (3.6) 1 (1.1)<br />
Belgium (Flemish) 40 (0.9) 558 (2.2) ◊ ◊ 33 (0.8) 545 (2.4) ◊ ◊ 27 (1.0) 538 (2.4) ◊ ◊<br />
Georgia 39 (1.3) 486 (3.4) ◊ ◊ 44 (1.0) 467 (3.2) ◊ ◊ 17 (1.2) 450 (7.6) ◊ ◊<br />
Bulgaria 39 (1.4) 565 (4.2) –14 (2.1) i 34 (1.1) 547 (4.7) 6 (1.6) h 27 (2.0) 532 (7.6) 8 (2.6) h<br />
Hong Kong SAR 36 (0.8) 574 (2.3) 6 (1.4) h 39 (0.7) 561 (2.6) 10 (1.0) h 25 (0.6) 558 (3.4) –15 (1.3) i<br />
Chinese Taipei 35 (0.9) 547 (2.5) ◊ ◊ 42 (0.7) 536 (2.5) ◊ ◊ 23 (0.7) 520 (2.4) ◊ ◊<br />
Moldova, Rep. of 35 (1.1) 509 (3.3) –1 (1.9) 46 (1.1) 498 (3.5) 6 (1.7) h 20 (1.5) 491 (5.9) –5 (1.9) i<br />
Indonesia 31 (1.2) 413 (4.6) ◊ ◊ 44 (1.3) 405 (4.5) ◊ ◊ 25 (1.3) 395 (4.9) ◊ ◊<br />
Romania 27 (1.1) 514 (4.7) 11 (1.6) h 43 (1.0) 497 (4.8) 11 (1.7) h 30 (1.4) 459 (8.0) –22 (2.4) i<br />
Morocco 24 (1.1) 346 (6.4) – – 34 (1.4) 329 (5.3) – – 42 (1.9) 308 (10.9) – –<br />
Iran, Islamic Rep. of 24 (1.1) 441 (4.9) 2 (1.5) 41 (1.1) 426 (3.4) 6 (1.8) h 35 (1.6) 402 (4.3) –8 (2.2) i<br />
Engl<strong>and</strong> x x x x x x x x x x x x x x x x x x<br />
United States – – – – – – – – – – – – – – – – – –<br />
International Avg. 47 (0.2) 512 (0.6) 34 (0.2) 498 (0.6) 18 (0.2) 487 (0.9)<br />
Background data provided by parents.<br />
( ) St<strong>and</strong>ard errors appear in parentheses. Because results are rounded to the nearest<br />
whole number, some totals may appear inconsistent.<br />
An “r” indicates data are available for 70–84% of the students. An “s” indicates data are<br />
available for 50–69% of the students. An “x” indicates data are available for less than<br />
50% of the students.<br />
h Percent in 2006 significantly higher<br />
i Percent in 2006 significantly lower<br />
A dash (–) indicates comparable data are not available.<br />
A diamond (◊) indicates the country did not participate in the 2001 assessment.<br />
<strong>PIRLS</strong> 2006<br />
4th Grade<br />
NOTE: The International Average does not include the results from the Canadian provinces.<br />
Trend Note: The primary education systems of the Russian Federation <strong>and</strong> Slovenia<br />
underwent structural changes. Data for Canada, Ontario include only public schools.<br />
SOURCE: IEA Progress in International Reading Literacy Study (<strong>PIRLS</strong>) 2006


