

here - TIMSS and PIRLS Home - Boston College
here - TIMSS and PIRLS Home - Boston College
here - TIMSS and PIRLS Home - Boston College

Create successful ePaper yourself
Turn your PDF publications into a flip-book with our unique Google optimized e-Paper software.
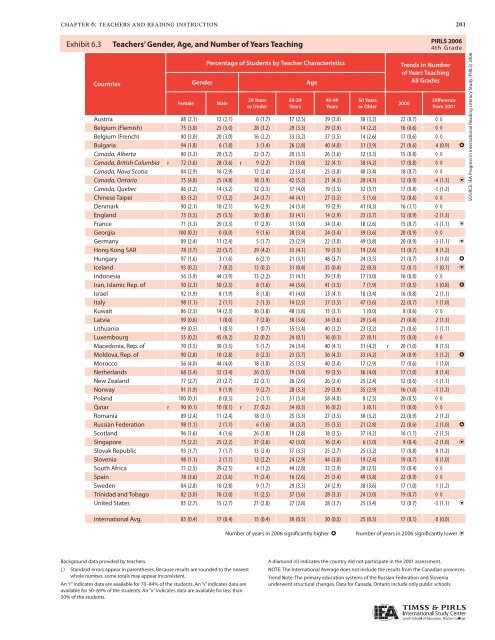
chapter 6: teachers <strong>and</strong> reading instruction<br />
Exhibit Exhibit 6.3 Teachers’ 6.3: Teachers’ Gender, Gender, Age, Age, <strong>and</strong> <strong>and</strong> Number Trends of Years in Average Teaching Number of Years Teaching<br />
Countries<br />
Percentage of Students by Teacher Characteristics Trends in Number<br />
of Years Teaching<br />
All Grades<br />
Gender Age<br />
Female Male<br />
29 Years<br />
or Under<br />
30-39<br />
Years<br />
40-49<br />
Years<br />
50 Years<br />
or Older<br />
2006<br />
Difference<br />
from 2001<br />
Austria 88 (2.1) 12 (2.1) 6 (1.7) 17 (2.5) 39 (3.0) 38 (3.2) 22 (0.7) ◊ ◊<br />
Belgium (Flemish) 75 (3.0) 25 (3.0) 28 (3.2) 29 (3.3) 29 (2.9) 14 (2.2) 16 (0.6) ◊ ◊<br />
Belgium (French) 80 (3.0) 20 (3.0) 16 (2.2) 33 (3.2) 37 (3.5) 14 (2.6) 17 (0.6) ◊ ◊<br />
Bulgaria 94 (1.8) 6 (1.8) 3 (1.4) 26 (2.8) 40 (4.0) 31 (3.9) 21 (0.6) 4 (0.9) h<br />
Canada, Alberta 80 (3.2) 20 (3.2) 22 (3.7) 20 (3.3) 26 (3.6) 32 (3.3) 15 (0.8) ◊ ◊<br />
Canada, British Columbia r 72 (3.6) 28 (3.6) r 9 (2.2) 21 (3.0) 32 (4.1) 38 (4.2) 17 (0.8) ◊ ◊<br />
Canada, Nova Scotia 84 (2.9) 16 (2.9) 12 (2.4) 22 (3.4) 25 (3.0) 40 (3.4) 18 (0.7) ◊ ◊<br />
Canada, Ontario 75 (4.8) 25 (4.8) 18 (3.9) 42 (5.2) 21 (4.3) 20 (4.3) 12 (0.9) -4 (1.3) i<br />
Canada, Quebec 86 (3.2) 14 (3.2) 12 (2.3) 37 (4.0) 19 (3.5) 32 (3.7) 17 (0.8) -1 (1.2)<br />
Chinese Taipei 83 (3.2) 17 (3.2) 24 (3.7) 44 (4.1) 27 (3.5) 5 (1.6) 12 (0.6) ◊ ◊<br />
Denmark 90 (2.1) 10 (2.1) 16 (2.9) 24 (3.4) 19 (2.9) 41 (4.3) 16 (1.1) ◊ ◊<br />
Engl<strong>and</strong> 75 (3.5) 25 (3.5) 30 (3.8) 33 (4.1) 14 (2.9) 23 (3.7) 12 (0.9) -2 (1.3)<br />
France 71 (3.3) 29 (3.3) 17 (2.9) 31 (3.0) 34 (3.4) 18 (2.6) 15 (0.7) -3 (1.1) i<br />
Georgia 100 (0.3) 0 (0.0) 9 (1.6) 28 (3.4) 24 (3.4) 39 (3.6) 20 (0.9) ◊ ◊<br />
Germany 89 (2.4) 11 (2.4) 5 (1.7) 23 (2.9) 22 (3.0) 49 (3.8) 20 (0.9) -3 (1.1) i<br />
Hong Kong SAR 78 (3.7) 22 (3.7) 29 (4.2) 33 (4.1) 19 (3.5) 19 (2.6) 13 (0.7) 0 (1.2)<br />
Hungary 97 (1.6) 3 (1.6) 6 (2.1) 21 (3.1) 48 (3.7) 24 (3.5) 21 (0.7) 3 (1.0) h<br />
Icel<strong>and</strong> 93 (0.2) 7 (0.2) 13 (0.3) 31 (0.4) 35 (0.4) 22 (0.3) 12 (0.1) -1 (0.1) i<br />
Indonesia 56 (3.9) 44 (3.9) 13 (2.2) 31 (4.1) 39 (3.9) 17 (3.0) 16 (0.8) ◊ ◊<br />
Iran, Islamic Rep. of 50 (2.3) 50 (2.3) 8 (1.6) 44 (3.6) 41 (3.5) 7 (1.9) 17 (0.5) 3 (0.8) h<br />
Israel 92 (1.9) 8 (1.9) 8 (1.8) 41 (4.0) 33 (4.1) 18 (3.4) 16 (0.8) 2 (1.1)<br />
Italy 98 (1.1) 2 (1.1) 2 (1.3) 14 (2.5) 37 (3.5) 47 (3.6) 22 (0.7) 1 (1.0)<br />
Kuwait 86 (2.3) 14 (2.3) 36 (3.8) 48 (3.8) 15 (3.1) 1 (0.0) 8 (0.6) ◊ ◊<br />
Latvia 99 (0.6) 1 (0.0) 7 (2.0) 30 (3.6) 34 (3.6) 29 (3.4) 21 (0.8) 2 (1.3)<br />
Lithuania 99 (0.5) 1 (0.5) 1 (0.7) 35 (3.4) 40 (3.2) 23 (3.2) 21 (0.6) 1 (1.1)<br />
Luxembourg 55 (0.2) 45 (0.2) 32 (0.2) 24 (0.1) 16 (0.1) 27 (0.1) 15 (0.0) ◊ ◊<br />
Macedonia, Rep. of 70 (3.5) 30 (3.5) 5 (1.7) 24 (3.4) 40 (4.1) 31 (4.2) r 20 (1.0) 0 (1.5)<br />
Moldova, Rep. of 90 (2.8) 10 (2.8) 8 (2.3) 23 (3.7) 36 (4.3) 33 (4.2) 24 (0.9) 5 (1.2) h<br />
Morocco 56 (4.0) 44 (4.0) 18 (3.0) 25 (3.5) 40 (3.4) 17 (2.9) 17 (0.6) 1 (1.0)<br />
Netherl<strong>and</strong>s 68 (3.4) 32 (3.4) 26 (3.5) 19 (3.0) 19 (3.5) 36 (4.0) 17 (1.0) 0 (1.4)<br />
New Zeal<strong>and</strong> 77 (2.7) 23 (2.7) 22 (2.1) 28 (2.6) 26 (2.4) 25 (2.4) 12 (0.6) -1 (1.1)<br />
Norway 91 (1.9) 9 (1.9) 9 (2.7) 28 (3.3) 29 (3.9) 35 (3.9) 16 (1.0) -1 (1.3)<br />
Pol<strong>and</strong> 100 (0.3) 0 (0.3) 2 (1.1) 31 (3.4) 58 (4.0) 8 (2.3) 20 (0.5) ◊ ◊<br />
Qatar r 90 (0.1) 10 (0.1) r 27 (0.2) 54 (0.3) 16 (0.2) 3 (0.1) 11 (0.0) ◊ ◊<br />
Romania 89 (2.4) 11 (2.4) 18 (3.1) 25 (3.3) 27 (3.5) 30 (3.2) 22 (0.9) 2 (1.2)<br />
Russian Federation 98 (1.1) 2 (1.1) 6 (1.6) 38 (3.7) 35 (3.5) 21 (2.8) 22 (0.6) 2 (1.0) h<br />
Scotl<strong>and</strong> 96 (1.6) 4 (1.6) 26 (3.8) 19 (2.8) 18 (3.5) 37 (4.2) 16 (1.1) -2 (1.5)<br />
Singapore 75 (2.2) 25 (2.2) 37 (2.6) 42 (3.0) 16 (2.4) 6 (1.0) 9 (0.4) -2 (1.0) i<br />
Slovak Republic 93 (1.7) 7 (1.7) 13 (2.4) 37 (3.5) 25 (2.7) 25 (3.2) 17 (0.8) 0 (1.2)<br />
Slovenia 98 (1.1) 2 (1.1) 12 (2.2) 24 (2.9) 44 (3.0) 19 (2.4) 19 (0.7) 0 (1.0)<br />
South Africa 71 (2.5) 29 (2.5) 4 (1.2) 44 (2.8) 32 (2.9) 20 (2.3) 15 (0.4) ◊ ◊<br />
Spain 78 (3.6) 22 (3.6) 11 (2.4) 16 (2.6) 25 (3.4) 49 (3.8) 22 (0.9) ◊ ◊<br />
Sweden 84 (2.8) 16 (2.8) 9 (1.7) 29 (3.3) 24 (2.9) 38 (3.6) 17 (1.0) 1 (1.2)<br />
Trinidad <strong>and</strong> Tobago 82 (3.0) 18 (3.0) 11 (2.5) 37 (3.6) 28 (3.3) 24 (3.0) 19 (0.7) ◊ ◊<br />
United States 85 (2.7) 15 (2.7) 21 (2.8) 27 (2.8) 28 (3.7) 25 (3.4) 12 (0.7) -3 (1.1) i<br />
International Avg. 83 (0.4) 17 (0.4) 15 (0.4) 30 (0.5) 30 (0.5) 25 (0.5) 17 (0.1) 0 (0.0)<br />
Background data provided by teachers.<br />
( ) St<strong>and</strong>ard errors appear in parentheses. Because results are rounded to the nearest<br />
whole number, some totals may appear inconsistent.<br />
An “r” indicates data are available for 70–84% of the students. An “s” indicates data are<br />
available for 50–69% of the students. An “x” indicates data are available for less than<br />
50% of the students.<br />
Number of years in 2006 significantly higher h Number of years in 2006 significantly lower i<br />
A diamond (◊) indicates the country did not participate in the 2001 assessment.<br />
201<br />
<strong>PIRLS</strong> 2006<br />
4th Grade<br />
NOTE: The International Average does not include the results from the Canadian provinces.<br />
Trend Note: The primary education systems of the Russian Federation <strong>and</strong> Slovenia<br />
underwent structural changes. Data for Canada, Ontario include only public schools.<br />
SOURCE: IEA Progress in International Reading Literacy Study (<strong>PIRLS</strong>) 2006


