

here - TIMSS and PIRLS Home - Boston College
here - TIMSS and PIRLS Home - Boston College
here - TIMSS and PIRLS Home - Boston College

You also want an ePaper? Increase the reach of your titles
YUMPU automatically turns print PDFs into web optimized ePapers that Google loves.
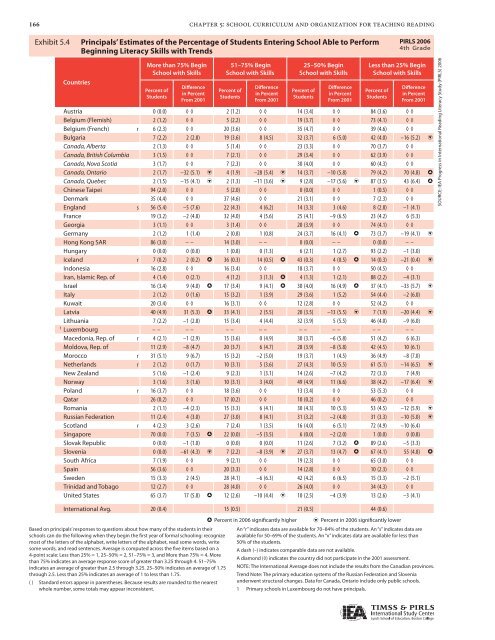
166 chapter 5: school curriculum <strong>and</strong> organization for teaching reading<br />
Exhibit Exhibit 5.4 Principals’ 5.4: Principals’ Estimates Estimates of the of Percentage the Percentage of Students of Students Entering Beginning School School Able to With Perform Early Literacy <strong>PIRLS</strong> 2006<br />
4th Grade<br />
Skills with Beginning Trends* Literacy Skills with Trends<br />
Countries<br />
More than 75% Begin<br />
School with Skills<br />
Percent of<br />
Students<br />
Difference<br />
in Percent<br />
From 2001<br />
51–75% Begin<br />
School with Skills<br />
Percent of<br />
Students<br />
Difference<br />
in Percent<br />
From 2001<br />
25–50% Begin<br />
School with Skills<br />
Percent of<br />
Students<br />
Difference<br />
in Percent<br />
From 2001<br />
Less than 25% Begin<br />
School with Skills<br />
Percent of<br />
Students<br />
Difference<br />
in Percent<br />
From 2001<br />
Austria 0 (0.0) ◊ ◊ 2 (1.2) ◊ ◊ 14 (3.4) ◊ ◊ 84 (3.6) ◊ ◊<br />
Belgium (Flemish) 2 (1.2) ◊ ◊ 5 (2.2) ◊ ◊ 19 (3.7) ◊ ◊ 73 (4.1) ◊ ◊<br />
Belgium (French) r 6 (2.3) ◊ ◊ 20 (3.6) ◊ ◊ 35 (4.7) ◊ ◊ 39 (4.6) ◊ ◊<br />
Bulgaria 7 (2.2) 2 (2.8) 19 (3.6) 8 (4.5) 32 (3.7) 6 (5.0) 42 (4.0) –16 (5.2) i<br />
Canada, Alberta 2 (1.3) ◊ ◊ 5 (1.4) ◊ ◊ 23 (3.3) ◊ ◊ 70 (3.7) ◊ ◊<br />
Canada, British Columbia 3 (1.5) ◊ ◊ 7 (2.1) ◊ ◊ 29 (3.4) ◊ ◊ 62 (3.9) ◊ ◊<br />
Canada, Nova Scotia 3 (1.7) ◊ ◊ 7 (2.3) ◊ ◊ 30 (4.0) ◊ ◊ 60 (4.3) ◊ ◊<br />
Canada, Ontario 2 (1.7) –32 (5.1) i 4 (1.9) –28 (5.4) i 14 (3.7) –10 (5.8) 79 (4.2) 70 (4.8) h<br />
Canada, Quebec 2 (1.5) –15 (4.1) i 2 (1.3) –11 (3.6) i 9 (2.8) –17 (5.6) i 87 (3.5) 43 (6.4) h<br />
Chinese Taipei 94 (2.0) ◊ ◊ 5 (2.0) ◊ ◊ 0 (0.0) ◊ ◊ 1 (0.5) ◊ ◊<br />
Denmark 35 (4.4) ◊ ◊ 37 (4.6) ◊ ◊ 21 (3.1) ◊ ◊ 7 (2.3) ◊ ◊<br />
Engl<strong>and</strong> s 56 (5.4) –5 (7.6) 22 (4.3) 4 (6.2) 14 (3.3) 3 (4.6) 8 (2.8) –1 (4.1)<br />
France 19 (3.2) –2 (4.8) 32 (4.0) 4 (5.6) 25 (4.1) –9 (6.5) 23 (4.2) 6 (5.3)<br />
Georgia 3 (1.1) ◊ ◊ 3 (1.4) ◊ ◊ 20 (3.9) ◊ ◊ 74 (4.1) ◊ ◊<br />
Germany 2 (1.2) 1 (1.4) 2 (0.8) 1 (0.8) 24 (3.7) 16 (4.1) h 73 (3.7) –19 (4.1) i<br />
Hong Kong SAR 86 (3.0) – – 14 (3.0) – – 0 (0.0) – – 0 (0.0) – –<br />
Hungary 0 (0.0) 0 (0.0) 1 (0.8) 0 (1.3) 6 (2.1) 1 (2.7) 93 (2.2) –1 (3.0)<br />
Icel<strong>and</strong> r 7 (0.2) 2 (0.2) h 36 (0.3) 14 (0.5) h 43 (0.3) 4 (0.5) h 14 (0.3) –21 (0.4) i<br />
Indonesia 16 (2.8) ◊ ◊ 16 (3.4) ◊ ◊ 18 (3.7) ◊ ◊ 50 (4.5) ◊ ◊<br />
Iran, Islamic Rep. of 4 (1.4) 0 (2.1) 4 (1.2) 3 (1.3) h 4 (1.3) 1 (2.1) 88 (2.2) –4 (3.1)<br />
Israel 16 (3.4) 9 (4.0) h 17 (3.4) 9 (4.1) h 30 (4.0) 16 (4.9) h 37 (4.1) –33 (5.7) i<br />
Italy 2 (1.2) 0 (1.6) 15 (3.2) 1 (3.9) 29 (3.6) 1 (5.2) 54 (4.4) –2 (6.0)<br />
Kuwait 20 (3.4) ◊ ◊ 16 (3.1) ◊ ◊ 12 (2.8) ◊ ◊ 52 (4.2) ◊ ◊<br />
Latvia 40 (4.9) 31 (5.3) h 33 (4.1) 2 (5.5) 20 (3.5) –13 (5.5) i 7 (1.9) –20 (4.4) i<br />
Lithuania 7 (2.2) –1 (2.8) 15 (3.4) 4 (4.4) 32 (3.9) 5 (5.5) 46 (4.0) –9 (6.0)<br />
1 Luxembourg – – – – – – – – – – – – – – – –<br />
Macedonia, Rep. of r 4 (2.1) –1 (2.9) 15 (3.6) 0 (4.9) 30 (3.7) –6 (5.8) 51 (4.2) 6 (6.3)<br />
Moldova, Rep. of 11 (2.9) –8 (4.7) 20 (3.7) 6 (4.7) 28 (3.9) –8 (5.8) 42 (4.5) 10 (6.1)<br />
Morocco r 31 (5.1) 9 (6.7) 15 (3.2) –2 (5.0) 19 (3.7) 1 (4.5) 36 (4.9) –8 (7.0)<br />
Netherl<strong>and</strong>s r 2 (1.2) 0 (1.7) 10 (3.1) 5 (3.6) 27 (4.3) 10 (5.5) 61 (5.1) –14 (6.5) i<br />
New Zeal<strong>and</strong> 5 (1.6) –1 (2.4) 9 (2.3) 1 (3.1) 14 (2.6) –7 (4.2) 72 (3.3) 7 (4.9)<br />
Norway 3 (1.6) 3 (1.6) 10 (3.1) 3 (4.0) 49 (4.9) 11 (6.6) 38 (4.2) –17 (6.4) i<br />
Pol<strong>and</strong> r 16 (3.7) ◊ ◊ 18 (3.6) ◊ ◊ 13 (3.4) ◊ ◊ 53 (5.3) ◊ ◊<br />
Qatar 26 (0.2) ◊ ◊ 17 (0.2) ◊ ◊ 10 (0.2) ◊ ◊ 46 (0.2) ◊ ◊<br />
Romania 2 (1.1) –4 (2.3) 15 (3.3) 6 (4.1) 30 (4.3) 10 (5.3) 53 (4.5) –12 (5.9) i<br />
Russian Federation 11 (2.4) 4 (3.0) 27 (3.0) 8 (4.1) 31 (3.2) –2 (4.8) 31 (3.3) –10 (5.0) i<br />
Scotl<strong>and</strong> r 4 (2.3) 3 (2.6) 7 (2.4) 1 (3.5) 16 (4.0) 6 (5.1) 72 (4.9) –10 (6.4)<br />
Singapore 70 (0.0) 7 (3.5) h 22 (0.0) –5 (3.5) 6 (0.0) –2 (2.0) 1 (0.0) 0 (0.8)<br />
Slovak Republic 0 (0.0) –1 (1.0) 0 (0.0) 0 (0.0) 11 (2.6) 7 (3.2) h 89 (2.6) –5 (3.3)<br />
Slovenia 0 (0.0) –61 (4.3) i 7 (2.2) –8 (3.9) i 27 (3.7) 13 (4.7) h 67 (4.1) 55 (4.8) h<br />
South Africa 7 (1.9) ◊ ◊ 9 (2.1) ◊ ◊ 19 (2.3) ◊ ◊ 65 (3.0) ◊ ◊<br />
Spain 56 (3.6) ◊ ◊ 20 (3.3) ◊ ◊ 14 (2.8) ◊ ◊ 10 (2.3) ◊ ◊<br />
Sweden 15 (3.3) 2 (4.5) 28 (4.1) –6 (6.3) 42 (4.2) 6 (6.5) 15 (3.3) –2 (5.1)<br />
Trinidad <strong>and</strong> Tobago 12 (2.7) ◊ ◊ 28 (4.0) ◊ ◊ 26 (4.0) ◊ ◊ 34 (4.3) ◊ ◊<br />
United States 65 (3.7) 17 (5.8) h 12 (2.6) –10 (4.4) i 10 (2.5) –4 (3.9) 13 (2.6) –3 (4.1)<br />
International Avg. 20 (0.4) 15 (0.5) 21 (0.5) 44 (0.6)<br />
Based on principals’ responses to questions about how many of the students in their<br />
schools can do the following when they begin the first year of formal schooling: recognize<br />
most of the letters of the alphabet, write letters of the alphabet, read some words, write<br />
some words, <strong>and</strong> read sentences. Average is computed across the five items based on a<br />
4-point scale: Less than 25% = 1, 25–50% = 2, 51–75% = 3, <strong>and</strong> More than 75% = 4. More<br />
than 75% indicates an average response score of greater than 3.25 through 4. 51–75%<br />
indicates an average of greater than 2.5 through 3.25. 25–50% indicates an average of 1.75<br />
through 2.5. Less than 25% indicates an average of 1 to less than 1.75.<br />
( ) St<strong>and</strong>ard errors appear in parentheses. Because results are rounded to the nearest<br />
whole number, some totals may appear inconsistent.<br />
h Percent in 2006 significantly higher i i Percent in 2006 significantly lower<br />
An “r” indicates data are available for 70–84% of the students. An “s” indicates data are<br />
available for 50–69% of the students. An “x” indicates data are available for less than<br />
50% of the students.<br />
A dash (–) indicates comparable data are not available.<br />
A diamond (◊) indicates the country did not participate in the 2001 assessment.<br />
NOTE: The International Average does not include the results from the Canadian provinces.<br />
Trend Note: The primary education systems of the Russian Federation <strong>and</strong> Slovenia<br />
underwent structural changes. Data for Canada, Ontario include only public schools.<br />
1 Primary schools in Luxembourg do not have principals.<br />
SOURCE: IEA Progress in International Reading Literacy Study (<strong>PIRLS</strong>) 2006


