

here - TIMSS and PIRLS Home - Boston College
here - TIMSS and PIRLS Home - Boston College
here - TIMSS and PIRLS Home - Boston College

Create successful ePaper yourself
Turn your PDF publications into a flip-book with our unique Google optimized e-Paper software.
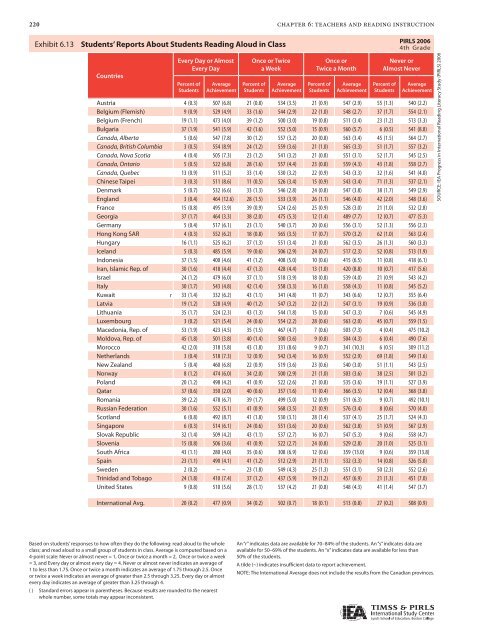
220 chapter 6: teachers <strong>and</strong> reading instruction<br />
Exhibit 6.13 Students’ Exhibit 6.13: Reports Students’ About Reports Students About Reading Students Aloud Reading in Class Aloud in Class*<br />
Countries<br />
Every Day or Almost<br />
Every Day<br />
Percent of<br />
Students<br />
Average<br />
Achievement<br />
Once or Twice<br />
a Week<br />
Percent of<br />
Students<br />
Average<br />
Achievement<br />
Once or<br />
Twice a Month<br />
Percent of<br />
Students<br />
Average<br />
Achievement<br />
Never or<br />
Almost Never<br />
Percent of<br />
Students<br />
Average<br />
Achievement<br />
Austria 4 (0.3) 507 (6.8) 21 (0.8) 534 (3.5) 21 (0.9) 547 (2.9) 55 (1.3) 540 (2.2)<br />
Belgium (Flemish) 9 (0.9) 529 (4.9) 33 (1.6) 544 (2.9) 22 (1.0) 548 (2.7) 37 (1.7) 554 (2.1)<br />
Belgium (French) 19 (1.1) 473 (4.0) 39 (1.2) 500 (3.0) 19 (0.8) 511 (3.4) 23 (1.2) 513 (3.3)<br />
Bulgaria 37 (1.9) 541 (5.9) 42 (1.6) 552 (5.0) 15 (0.9) 560 (5.7) 6 (0.5) 541 (8.8)<br />
Canada, Alberta 5 (0.6) 547 (7.8) 30 (1.2) 557 (3.2) 20 (0.8) 563 (3.4) 45 (1.5) 564 (2.7)<br />
Canada, British Columbia 3 (0.5) 554 (8.9) 24 (1.2) 559 (3.6) 21 (1.0) 565 (3.3) 51 (1.7) 557 (3.2)<br />
Canada, Nova Scotia 4 (0.4) 505 (7.3) 23 (1.2) 541 (3.2) 21 (0.8) 551 (3.1) 52 (1.7) 545 (2.5)<br />
Canada, Ontario 5 (0.5) 522 (6.8) 28 (1.6) 557 (4.4) 23 (0.8) 559 (4.3) 43 (1.8) 558 (2.7)<br />
Canada, Quebec 13 (0.9) 511 (5.2) 33 (1.4) 530 (3.2) 22 (0.9) 543 (3.3) 32 (1.6) 541 (4.0)<br />
Chinese Taipei 3 (0.3) 511 (8.6) 11 (0.5) 526 (3.4) 15 (0.9) 543 (3.4) 71 (1.3) 537 (2.1)<br />
Denmark 5 (0.7) 532 (6.6) 33 (1.3) 546 (2.8) 24 (0.8) 547 (3.8) 38 (1.7) 549 (2.9)<br />
Engl<strong>and</strong> 3 (0.4) 464 (12.6) 28 (1.5) 533 (3.9) 26 (1.1) 546 (4.0) 42 (2.0) 548 (3.6)<br />
France 15 (0.8) 495 (3.9) 39 (0.9) 524 (2.6) 25 (0.9) 528 (3.0) 21 (1.0) 532 (2.8)<br />
Georgia 37 (1.7) 464 (3.3) 38 (2.0) 475 (5.3) 12 (1.4) 489 (7.7) 12 (0.7) 477 (5.3)<br />
Germany 5 (0.4) 517 (6.1) 23 (1.1) 540 (3.7) 20 (0.6) 556 (3.1) 52 (1.3) 556 (2.3)<br />
Hong Kong SAR 4 (0.3) 552 (6.2) 18 (0.8) 565 (3.5) 17 (0.7) 570 (3.2) 62 (1.0) 563 (2.4)<br />
Hungary 16 (1.1) 525 (6.2) 37 (1.3) 551 (3.4) 21 (0.8) 562 (3.5) 26 (1.3) 560 (3.3)<br />
Icel<strong>and</strong> 5 (0.3) 485 (5.9) 19 (0.6) 506 (2.9) 24 (0.7) 517 (2.3) 52 (0.8) 513 (1.9)<br />
Indonesia 37 (1.5) 400 (4.6) 41 (1.2) 408 (5.0) 10 (0.6) 415 (6.5) 11 (0.8) 418 (6.1)<br />
Iran, Islamic Rep. of 30 (1.6) 418 (4.4) 47 (1.3) 428 (4.4) 13 (1.0) 420 (8.8) 10 (0.7) 417 (5.6)<br />
Israel 24 (1.2) 479 (6.0) 37 (1.1) 518 (3.9) 18 (0.8) 539 (4.0) 21 (0.9) 543 (4.2)<br />
Italy 30 (1.7) 543 (4.8) 42 (1.4) 558 (3.3) 16 (1.0) 558 (4.3) 11 (0.8) 545 (5.2)<br />
Kuwait r 33 (1.4) 332 (6.2) 43 (1.1) 341 (4.8) 11 (0.7) 343 (6.6) 12 (0.7) 355 (6.4)<br />
Latvia 19 (1.2) 528 (4.9) 40 (1.2) 547 (3.2) 22 (1.2) 547 (3.1) 19 (0.9) 536 (3.0)<br />
Lithuania 35 (1.7) 524 (2.3) 43 (1.3) 544 (1.8) 15 (0.8) 547 (3.3) 7 (0.6) 545 (4.9)<br />
Luxembourg 3 (0.2) 521 (5.4) 24 (0.6) 554 (2.2) 28 (0.6) 563 (2.0) 45 (0.7) 559 (1.5)<br />
Macedonia, Rep. of 53 (1.9) 423 (4.5) 35 (1.5) 467 (4.7) 7 (0.6) 503 (7.3) 4 (0.4) 475 (10.2)<br />
Moldova, Rep. of 45 (1.8) 501 (3.8) 40 (1.4) 500 (3.6) 9 (0.8) 504 (4.3) 6 (0.4) 490 (7.6)<br />
Morocco 42 (2.0) 318 (5.8) 43 (1.8) 331 (8.6) 9 (0.7) 341 (10.3) 6 (0.5) 309 (11.2)<br />
Netherl<strong>and</strong>s 3 (0.4) 518 (7.3) 12 (0.9) 542 (3.4) 16 (0.9) 552 (2.9) 69 (1.8) 549 (1.6)<br />
New Zeal<strong>and</strong> 5 (0.4) 460 (6.8) 22 (0.9) 519 (3.6) 23 (0.6) 540 (3.0) 51 (1.1) 543 (2.5)<br />
Norway 8 (1.2) 474 (6.0) 34 (2.0) 500 (2.9) 21 (1.0) 503 (3.6) 38 (2.5) 501 (3.2)<br />
Pol<strong>and</strong> 20 (1.2) 498 (4.2) 41 (0.9) 522 (2.6) 21 (0.8) 535 (3.6) 19 (1.1) 527 (3.9)<br />
Qatar 37 (0.6) 350 (2.0) 40 (0.6) 357 (1.6) 11 (0.4) 366 (3.5) 12 (0.4) 368 (3.8)<br />
Romania 39 (2.2) 478 (6.7) 39 (1.7) 499 (5.0) 12 (0.9) 511 (6.3) 9 (0.7) 492 (10.1)<br />
Russian Federation 30 (1.6) 552 (5.1) 41 (0.9) 568 (3.5) 21 (0.9) 576 (3.4) 8 (0.6) 570 (4.0)<br />
Scotl<strong>and</strong> 6 (0.8) 492 (8.7) 41 (1.8) 530 (3.1) 28 (1.4) 537 (4.1) 25 (1.7) 524 (4.3)<br />
Singapore 6 (0.3) 514 (6.1) 24 (0.6) 551 (3.6) 20 (0.6) 562 (3.8) 51 (0.9) 567 (2.9)<br />
Slovak Republic 32 (1.4) 509 (4.2) 43 (1.1) 537 (2.7) 16 (0.7) 547 (5.3) 9 (0.6) 558 (4.7)<br />
Slovenia 15 (0.8) 506 (3.6) 41 (0.9) 522 (2.7) 24 (0.8) 529 (2.8) 20 (1.0) 525 (3.1)<br />
South Africa 43 (1.1) 280 (4.0) 35 (0.6) 308 (6.9) 12 (0.6) 359 (13.0) 9 (0.6) 359 (13.8)<br />
Spain 23 (1.1) 490 (4.1) 41 (1.2) 512 (2.9) 21 (1.1) 532 (3.3) 14 (0.8) 526 (5.0)<br />
Sweden 2 (0.2) ~ ~ 23 (1.8) 549 (4.3) 25 (1.3) 551 (3.1) 50 (2.3) 552 (2.6)<br />
Trinidad <strong>and</strong> Tobago 24 (1.8) 410 (7.4) 37 (1.2) 437 (5.9) 19 (1.2) 457 (6.9) 21 (1.3) 451 (7.0)<br />
United States 9 (0.8) 510 (5.6) 28 (1.1) 537 (4.2) 21 (0.8) 548 (4.3) 41 (1.4) 547 (3.7)<br />
International Avg. 20 (0.2) 477 (0.9) 34 (0.2) 502 (0.7) 18 (0.1) 513 (0.8) 27 (0.2) 508 (0.9)<br />
Based on students’ responses to how often they do the following: read aloud to the whole<br />
class; <strong>and</strong> read aloud to a small group of students in class. Average is computed based on a<br />
4-point scale: Never or almost never = 1, Once or twice a month = 2, Once or twice a week<br />
= 3, <strong>and</strong> Every day or almost every day = 4. Never or almost never indicates an average of<br />
1 to less than 1.75. Once or twice a month indicates an average of 1.75 through 2.5. Once<br />
or twice a week indicates an average of greater than 2.5 through 3.25. Every day or almost<br />
every day indicates an average of greater than 3.25 through 4.<br />
( ) St<strong>and</strong>ard errors appear in parentheses. Because results are rounded to the nearest<br />
whole number, some totals may appear inconsistent.<br />
An “r” indicates data are available for 70–84% of the students. An “s” indicates data are<br />
available for 50–69% of the students. An “x” indicates data are available for less than<br />
50% of the students.<br />
A tilde (~) indicates insufficient data to report achievement.<br />
<strong>PIRLS</strong> 2006<br />
4th Grade<br />
NOTE: The International Average does not include the results from the Canadian provinces.<br />
SOURCE: IEA Progress in International Reading Literacy Study (<strong>PIRLS</strong>) 2006


