

here - TIMSS and PIRLS Home - Boston College
here - TIMSS and PIRLS Home - Boston College
here - TIMSS and PIRLS Home - Boston College

You also want an ePaper? Increase the reach of your titles
YUMPU automatically turns print PDFs into web optimized ePapers that Google loves.
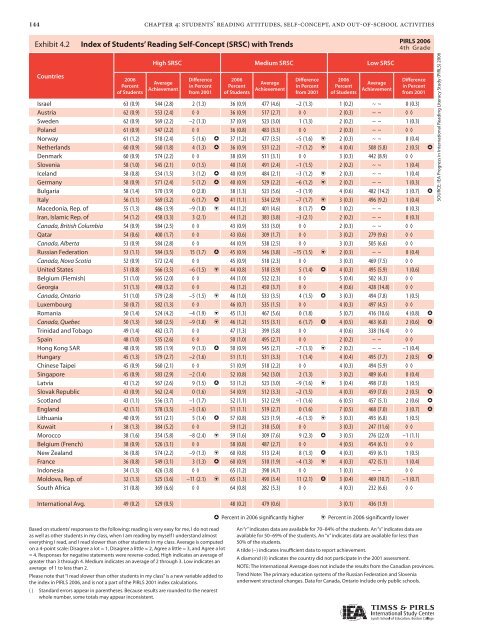
144 chapter 4: students’ reading attitudes, self-concept, <strong>and</strong> out-of-school activities<br />
Exhibit 4.2: 4.2 Index Index of of Students’ Reading Self Self-Concept Concept (SRSC) with with Trends<br />
Countries<br />
2006<br />
Percent<br />
of Students<br />
High SRSC Medium SRSC Low SRSC<br />
Average<br />
Achievement<br />
Difference<br />
in Percent<br />
from 2001<br />
2006<br />
Percent<br />
of Students<br />
Average<br />
Achievement<br />
Difference<br />
in Percent<br />
from 2001<br />
2006<br />
Percent<br />
of Students<br />
Average<br />
Achievement<br />
Difference<br />
in Percent<br />
from 2001<br />
Israel 63 (0.9) 544 (2.8) 2 (1.3) 36 (0.9) 477 (4.6) –2 (1.3) 1 (0.2) ~ ~ 0 (0.3)<br />
Austria 62 (0.9) 553 (2.4) ◊ ◊ 36 (0.9) 517 (2.7) ◊ ◊ 2 (0.3) ~ ~ ◊ ◊<br />
Sweden 62 (0.9) 569 (2.2) –2 (1.3) 37 (0.9) 523 (3.0) 1 (1.3) 2 (0.2) ~ ~ 1 (0.3)<br />
Pol<strong>and</strong> 61 (0.9) 547 (2.2) ◊ ◊ 36 (0.8) 483 (3.3) ◊ ◊ 2 (0.3) ~ ~ ◊ ◊<br />
Norway 61 (1.2) 518 (2.4) 5 (1.6) h 37 (1.2) 477 (3.5) –5 (1.6) i 2 (0.3) ~ ~ 0 (0.4)<br />
Netherl<strong>and</strong>s 60 (0.9) 560 (1.8) 4 (1.3) h 36 (0.9) 531 (2.2) –7 (1.2) i 4 (0.4) 508 (5.8) 2 (0.5) h<br />
Denmark 60 (0.9) 574 (2.2) ◊ ◊ 38 (0.9) 511 (3.1) ◊ ◊ 3 (0.3) 442 (8.9) ◊ ◊<br />
Slovenia 58 (1.0) 545 (2.1) 0 (1.5) 40 (1.0) 491 (2.4) –1 (1.5) 2 (0.2) ~ ~ 1 (0.4)<br />
Icel<strong>and</strong> 58 (0.8) 534 (1.5) 3 (1.2) h 40 (0.9) 484 (2.1) –3 (1.2) i 2 (0.3) ~ ~ 1 (0.4)<br />
Germany 58 (0.9) 571 (2.4) 5 (1.2) h 40 (0.9) 529 (2.2) –6 (1.2) i 2 (0.2) ~ ~ 1 (0.3)<br />
Bulgaria 58 (1.4) 570 (3.9) 0 (2.0) 38 (1.3) 523 (5.6) –3 (1.9) 4 (0.6) 482 (14.2) 3 (0.7) h<br />
Italy 56 (1.1) 569 (3.2) 6 (1.7) h 41 (1.1) 534 (2.9) –7 (1.7) i 3 (0.3) 496 (9.2) 1 (0.4)<br />
Macedonia, Rep. of 55 (1.3) 486 (3.9) –9 (1.8) i 44 (1.2) 401 (4.6) 8 (1.7) h 1 (0.2) ~ ~ 0 (0.3)<br />
Iran, Islamic Rep. of 54 (1.2) 458 (3.3) 3 (2.1) 44 (1.2) 383 (3.8) –3 (2.1) 2 (0.2) ~ ~ 0 (0.3)<br />
Canada, British Columbia 54 (0.9) 584 (2.5) ◊ ◊ 43 (0.9) 533 (3.0) ◊ ◊ 2 (0.3) ~ ~ ◊ ◊<br />
Qatar 54 (0.6) 400 (1.7) ◊ ◊ 43 (0.6) 309 (1.7) ◊ ◊ 3 (0.2) 279 (9.6) ◊ ◊<br />
Canada, Alberta 53 (0.9) 584 (2.8) ◊ ◊ 44 (0.9) 538 (2.5) ◊ ◊ 3 (0.3) 505 (6.6) ◊ ◊<br />
Russian Federation 53 (1.1) 584 (3.5) 15 (1.7) h 45 (0.9) 546 (3.8) –15 (1.5) i 2 (0.3) ~ ~ 0 (0.4)<br />
Canada, Nova Scotia 52 (0.9) 572 (2.4) ◊ ◊ 45 (0.9) 518 (2.3) ◊ ◊ 3 (0.3) 469 (7.5) ◊ ◊<br />
United States 51 (0.8) 566 (3.5) –6 (1.5) i 44 (0.8) 518 (3.9) 5 (1.4) h 4 (0.3) 495 (5.9) 1 (0.6)<br />
Belgium (Flemish) 51 (1.0) 565 (2.0) ◊ ◊ 44 (1.0) 532 (2.3) ◊ ◊ 5 (0.4) 502 (4.3) ◊ ◊<br />
Georgia 51 (1.3) 498 (3.2) ◊ ◊ 46 (1.2) 450 (3.7) ◊ ◊ 4 (0.6) 428 (14.8) ◊ ◊<br />
Canada, Ontario 51 (1.0) 579 (2.8) –5 (1.5) i 46 (1.0) 533 (3.5) 4 (1.5) h 3 (0.3) 494 (7.8) 1 (0.5)<br />
Luxembourg 50 (0.7) 582 (1.3) ◊ ◊ 46 (0.7) 535 (1.5) ◊ ◊ 4 (0.3) 497 (4.5) ◊ ◊<br />
Romania 50 (1.4) 524 (4.2) –4 (1.9) i 45 (1.3) 467 (5.6) 0 (1.8) 5 (0.7) 416 (10.6) 4 (0.8) h<br />
Canada, Quebec 50 (1.3) 560 (2.5) –9 (1.8) i 46 (1.2) 515 (3.1) 6 (1.7) h 4 (0.5) 463 (6.8) 2 (0.6) h<br />
Trinidad <strong>and</strong> Tobago 49 (1.4) 482 (3.7) ◊ ◊ 47 (1.3) 399 (5.8) ◊ ◊ 4 (0.6) 338 (16.4) ◊ ◊<br />
Spain 48 (1.0) 535 (2.6) ◊ ◊ 50 (1.0) 495 (2.7) ◊ ◊ 2 (0.2) ~ ~ ◊ ◊<br />
Hong Kong SAR 48 (0.9) 585 (1.9) 9 (1.3) h 50 (0.9) 545 (2.7) –7 (1.3) i 2 (0.2) ~ ~ –1 (0.4)<br />
Hungary 45 (1.3) 579 (2.7) –2 (1.6) 51 (1.1) 531 (3.3) 1 (1.4) 4 (0.4) 495 (7.7) 2 (0.5) h<br />
Chinese Taipei 45 (0.9) 560 (2.1) ◊ ◊ 51 (0.9) 518 (2.2) ◊ ◊ 4 (0.3) 494 (5.9) ◊ ◊<br />
Singapore 45 (0.9) 583 (2.9) –2 (1.4) 52 (0.8) 542 (3.0) 2 (1.3) 3 (0.2) 489 (6.4) 0 (0.4)<br />
Latvia 43 (1.2) 567 (2.6) 9 (1.5) h 53 (1.2) 523 (3.0) –9 (1.6) i 3 (0.4) 498 (7.0) 1 (0.5)<br />
Slovak Republic 43 (0.9) 562 (2.4) 0 (1.6) 54 (0.9) 512 (3.3) –2 (1.5) 4 (0.3) 459 (7.0) 2 (0.5) h<br />
Scotl<strong>and</strong> 43 (1.1) 556 (3.7) –1 (1.7) 52 (1.1) 512 (2.9) –1 (1.6) 6 (0.5) 457 (5.1) 2 (0.6) h<br />
Engl<strong>and</strong> 42 (1.1) 578 (3.5) –3 (1.6) 51 (1.1) 519 (2.7) 0 (1.6) 7 (0.5) 468 (7.0) 3 (0.7) h<br />
Lithuania 40 (0.9) 561 (2.1) 5 (1.4) h 57 (0.8) 523 (1.9) –6 (1.3) i 3 (0.3) 493 (6.8) 1 (0.5)<br />
Kuwait r 38 (1.3) 384 (5.2) ◊ ◊ 59 (1.2) 318 (5.0) ◊ ◊ 3 (0.3) 247 (11.6) ◊ ◊<br />
Morocco 38 (1.6) 354 (5.8) –8 (2.4) i 59 (1.6) 309 (7.6) 9 (2.3) h 3 (0.5) 276 (22.0) –1 (1.1)<br />
Belgium (French) 38 (0.9) 526 (3.1) ◊ ◊ 58 (0.8) 487 (2.7) ◊ ◊ 4 (0.5) 454 (6.1) ◊ ◊<br />
New Zeal<strong>and</strong> 36 (0.8) 574 (2.2) –9 (1.3) i 60 (0.8) 513 (2.4) 8 (1.3) h 4 (0.3) 459 (6.1) 1 (0.5)<br />
France 36 (0.8) 549 (3.1) 3 (1.3) h 60 (0.9) 510 (1.9) –4 (1.3) i 4 (0.3) 472 (5.1) 1 (0.4)<br />
Indonesia 34 (1.3) 426 (3.8) ◊ ◊ 65 (1.2) 398 (4.7) ◊ ◊ 1 (0.3) ~ ~ ◊ ◊<br />
Moldova, Rep. of 32 (1.3) 525 (3.6) –11 (2.1) i 65 (1.3) 490 (3.4) 11 (2.1) h 3 (0.4) 469 (10.7) –1 (0.7)<br />
South Africa 31 (0.8) 369 (6.6) ◊ ◊ 64 (0.8) 282 (5.3) ◊ ◊ 4 (0.3) 232 (6.6) ◊ ◊<br />
International Avg. 49 (0.2) 529 (0.5) 48 (0.2) 479 (0.6) 3 (0.1) 436 (1.9)<br />
Based on students’ responses to the following: reading is very easy for me, I do not read<br />
as well as other students in my class, when I am reading by myself I underst<strong>and</strong> almost<br />
everything I read, <strong>and</strong> I read slower than other students in my class. Average is computed<br />
on a 4-point scale: Disagree a lot = 1, Disagree a little = 2, Agree a little = 3, <strong>and</strong> Agree a lot<br />
= 4. Responses for negative statements were reverse-coded. High indicates an average of<br />
greater than 3 through 4. Medium indicates an average of 2 through 3. Low indicates an<br />
average of 1 to less than 2.<br />
Please note that “I read slower than other students in my class” is a new variable added to<br />
the index in <strong>PIRLS</strong> 2006, <strong>and</strong> is not a part of the <strong>PIRLS</strong> 2001 index calculations.<br />
( ) St<strong>and</strong>ard errors appear in parentheses. Because results are rounded to the nearest<br />
whole number, some totals may appear inconsistent.<br />
h Percent in 2006 significantly higher i Percent in 2006 significantly lower<br />
An “r” indicates data are available for 70–84% of the students. An “s” indicates data are<br />
available for 50–69% of the students. An “x” indicates data are available for less than<br />
50% of the students.<br />
A tilde (~) indicates insufficient data to report achievement.<br />
A diamond (◊) indicates the country did not participate in the 2001 assessment.<br />
<strong>PIRLS</strong> 2006<br />
4th Grade<br />
NOTE: The International Average does not include the results from the Canadian provinces.<br />
Trend Note: The primary education systems of the Russian Federation <strong>and</strong> Slovenia<br />
underwent structural changes. Data for Canada, Ontario include only public schools.<br />
SOURCE: IEA Progress in International Reading Literacy Study (<strong>PIRLS</strong>) 2006


