- Page 3 and 4:
PIRLS 2006 International Report IEA
- Page 5 and 6:
Contents Executive Summary 1 Introd
- Page 7 and 8:
Chapter 3 105 Literacy-related Acti
- Page 9 and 10:
Exhibit 6.16 Students Answer Questi
- Page 11:
Appendix C 327 Percentiles and Stan
- Page 14 and 15:
executive summary Building on the P
- Page 16 and 17:
Changes in Reading Achievement: PIR
- Page 18 and 19:
executive summary percentages of st
- Page 20 and 21:
▶ ▶ ▶ ▶ ▶ executive summa
- Page 22 and 23:
10 executive summary ▶ ▶ ▶
- Page 24:
1 executive summary ▶ ▶ ▶ ▶
- Page 28 and 29:
16 introduction The IEA (Internatio
- Page 30 and 31:
18 introduction An important innova
- Page 32 and 33:
20 introduction What Background Inf
- Page 34 and 35:
22 introduction Exhibit Countries P
- Page 36 and 37:
24 introduction For the sake of com
- Page 38 and 39:
26 introduction Exhibit 2 Exhibit 2
- Page 40 and 41:
28 introduction Which Students Were
- Page 42 and 43:
30 introduction Exhibit Exhibit 3 3
- Page 44:
32 introduction The student samplin
- Page 48 and 49:
36 chapter 1: international student
- Page 50 and 51:
38 chapter 1: international student
- Page 52 and 53:
40 chapter 1: international student
- Page 54 and 55:
42 chapter 1: international student
- Page 56 and 57:
44 chapter 1: international student
- Page 58 and 59:
46 chapter 1: international student
- Page 60 and 61:
48 chapter 1: international student
- Page 62 and 63:
50 chapter 1: international student
- Page 64 and 65:
52 chapter 1: international student
- Page 66 and 67:
54 chapter 1: international student
- Page 68 and 69:
56 chapter 1: international student
- Page 70 and 71:
58 chapter 1: international student
- Page 72 and 73:
60 chapter 1: international student
- Page 74 and 75:
62 chapter 1: international student
- Page 76:
64 chapter 1: international student
- Page 80 and 81:
68 chapter 2: performance at intern
- Page 82 and 83:
70 chapter 2: performance at intern
- Page 84 and 85:
72 chapter 2: performance at intern
- Page 86 and 87:
74 chapter 2: performance at intern
- Page 88 and 89:
76 chapter 2: performance at intern
- Page 90 and 91:
78 chapter 2: performance at intern
- Page 92 and 93:
80 chapter 2: performance at intern
- Page 94 and 95:
82 chapter 2: performance at intern
- Page 96 and 97:
84 chapter 2: performance at intern
- Page 98 and 99:
86 chapter 2: performance at intern
- Page 100 and 101:
88 chapter 2: performance at intern
- Page 102 and 103:
90 chapter 2: performance at intern
- Page 104 and 105:
92 chapter 2: performance at intern
- Page 106 and 107:
94 chapter 2: performance at intern
- Page 108 and 109:
96 chapter 2: performance at intern
- Page 110 and 111:
98 chapter 2: performance at intern
- Page 112 and 113:
100 chapter 2: performance at inter
- Page 114 and 115:
102 chapter 2: performance at inter
- Page 117 and 118:
Chapter 3 Literacy-related Activiti
- Page 119 and 120:
chapter 3: literacy-related activit
- Page 121 and 122:
chapter 3: literacy-related activit
- Page 123 and 124:
chapter 3: literacy-related activit
- Page 125 and 126:
chapter 3: literacy-related activit
- Page 127 and 128:
chapter 3: literacy-related activit
- Page 129 and 130:
chapter 3: literacy-related activit
- Page 131 and 132:
chapter 3: literacy-related activit
- Page 133 and 134:
chapter 3: literacy-related activit
- Page 135 and 136:
chapter 3: literacy-related activit
- Page 137 and 138:
chapter 3: literacy-related activit
- Page 139 and 140:
chapter 3: literacy-related activit
- Page 141 and 142:
chapter 3: literacy-related activit
- Page 143 and 144:
chapter 3: literacy-related activit
- Page 145 and 146:
chapter 3: literacy-related activit
- Page 147 and 148:
chapter 3: literacy-related activit
- Page 151 and 152:
Chapter 4 Students’ Reading Attit
- Page 153 and 154:
chapter 4: students’ reading atti
- Page 155 and 156:
chapter 4: students’ reading atti
- Page 157 and 158:
chapter 4: students’ reading atti
- Page 159 and 160:
chapter 4: students’ reading atti
- Page 161 and 162:
chapter 4: students’ reading atti
- Page 163 and 164:
chapter 4: students’ reading atti
- Page 165 and 166:
chapter 4: students’ reading atti
- Page 167:
chapter 4: students’ reading atti
- Page 170 and 171:
140 chapter 4: students’ reading
- Page 172 and 173:
142 chapter 4: students’ reading
- Page 174 and 175:
144 chapter 4: students’ reading
- Page 176 and 177:
146 chapter 4: students’ reading
- Page 178 and 179:
148 chapter 4: students’ reading
- Page 180 and 181:
150 chapter 4: students’ reading
- Page 182 and 183:
152 chapter 4: students’ reading
- Page 184 and 185:
154 chapter 4: students’ reading
- Page 187 and 188:
Chapter 5 School Curriculum and Org
- Page 189 and 190:
chapter 5: school curriculum and or
- Page 191 and 192:
chapter 5: school curriculum and or
- Page 193 and 194:
chapter 5: school curriculum and or
- Page 195 and 196:
chapter 5: school curriculum and or
- Page 197 and 198:
chapter 5: school curriculum and or
- Page 199 and 200:
chapter 5: school curriculum and or
- Page 201 and 202:
chapter 5: school curriculum and or
- Page 203 and 204:
chapter 5: school curriculum and or
- Page 205 and 206:
chapter 5: school curriculum and or
- Page 207 and 208:
chapter 5: school curriculum and or
- Page 209 and 210:
chapter 5: school curriculum and or
- Page 211 and 212:
chapter 5: school curriculum and or
- Page 213 and 214:
chapter 5: school curriculum and or
- Page 215 and 216:
chapter 5: school curriculum and or
- Page 217 and 218:
chapter 5: school curriculum and or
- Page 219 and 220:
chapter 5: school curriculum and or
- Page 221 and 222:
chapter 5: school curriculum and or
- Page 223:
chapter 5: school curriculum and or
- Page 226 and 227:
196 chapter 6: teachers and reading
- Page 228 and 229:
198 chapter 6: teachers and reading
- Page 230 and 231:
200 chapter 6: teachers and reading
- Page 232 and 233:
202 chapter 6: teachers and reading
- Page 234 and 235:
204 chapter 6: teachers and reading
- Page 236 and 237:
206 chapter 6: teachers and reading
- Page 238 and 239:
208 chapter 6: teachers and reading
- Page 240 and 241:
210 chapter 6: teachers and reading
- Page 242 and 243:
212 chapter 6: teachers and reading
- Page 244 and 245:
214 chapter 6: teachers and reading
- Page 246 and 247:
216 chapter 6: teachers and reading
- Page 248 and 249:
218 chapter 6: teachers and reading
- Page 250 and 251:
220 chapter 6: teachers and reading
- Page 252 and 253:
222 chapter 6: teachers and reading
- Page 254 and 255:
224 chapter 6: teachers and reading
- Page 256 and 257:
226 chapter 6: teachers and reading
- Page 258 and 259:
228 chapter 6: teachers and reading
- Page 260 and 261:
230 chapter 6: teachers and reading
- Page 262 and 263:
232 chapter 6: teachers and reading
- Page 264 and 265:
234 chapter 6: teachers and reading
- Page 266 and 267:
236 chapter 6: teachers and reading
- Page 268 and 269:
238 chapter 6: teachers and reading
- Page 270 and 271: 240 chapter 6: teachers and reading
- Page 272: 242 chapter 6: teachers and reading
- Page 276 and 277: 246 chapter 7: school contexts area
- Page 278 and 279: 248 chapter 7: school contexts of t
- Page 280 and 281: 250 chapter 7: school contexts Exhi
- Page 282 and 283: 252 chapter 7: school contexts Exhi
- Page 284 and 285: 254 chapter 7: school contexts What
- Page 286 and 287: 256 chapter 7: school contexts Exhi
- Page 288 and 289: 258 chapter 7: school contexts Give
- Page 290 and 291: 260 chapter 7: school contexts Exhi
- Page 292 and 293: 262 chapter 7: school contexts It i
- Page 294 and 295: 264 chapter 7: school contexts Exhi
- Page 296 and 297: 266 chapter 7: school contexts year
- Page 298 and 299: 268 chapter 7: school contexts Exhi
- Page 300 and 301: 270 chapter 7: school contexts stud
- Page 302 and 303: 272 chapter 7: school contexts perc
- Page 304 and 305: 274 chapter 7: school contexts As s
- Page 306 and 307: 276 chapter 7: school contexts Exhi
- Page 308 and 309: 278 chapter 7: school contexts Comp
- Page 311 and 312: Appendix A Supplementary Informatio
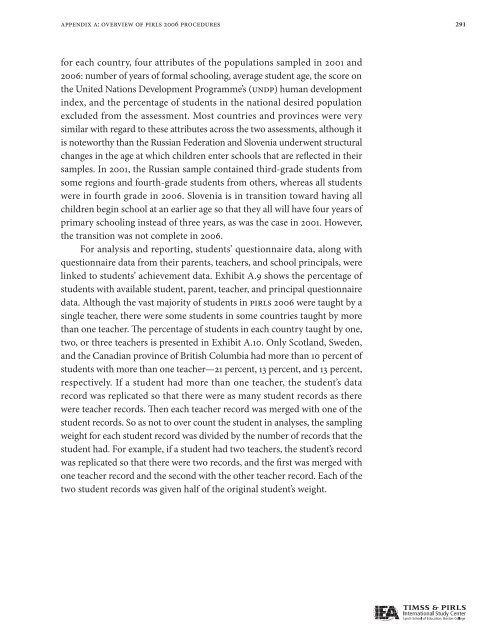
- Page 313 and 314: appendix a: overview of pirls 2006
- Page 315 and 316: appendix a: overview of pirls 2006
- Page 317 and 318: appendix a: overview of pirls 2006
- Page 319: appendix a: overview of pirls 2006
- Page 323 and 324: appendix a: overview of pirls 2006
- Page 325 and 326: appendix a: overview of pirls 2006
- Page 327 and 328: appendix a: overview of pirls 2006
- Page 329 and 330: appendix a: overview of pirls 2006
- Page 331 and 332: appendix a: overview of pirls 2006
- Page 333 and 334: appendix a: overview of pirls 2006
- Page 335 and 336: appendix a: overview of pirls 2006
- Page 337 and 338: appendix a: overview of pirls 2006
- Page 339 and 340: appendix a: overview of pirls 2006
- Page 341 and 342: appendix a: overview of pirls 2006
- Page 343 and 344: appendix a: overview of pirls 2006
- Page 347 and 348: Appendix B Multiple Comparisons of
- Page 349 and 350: appendix b: multiple comparisons of
- Page 351 and 352: appendix b: multiple comparisons of
- Page 353 and 354: appendix b: multiple comparisons of
- Page 355: appendix b: multiple comparisons of
- Page 358 and 359: 328 appendix c: percentiles and sta
- Page 360 and 361: 330 appendix c: percentiles and sta
- Page 362 and 363: 332 appendix c: percentiles and sta
- Page 364 and 365: 334 appendix c: percentiles and sta
- Page 366 and 367: 336 appendix c: percentiles and sta
- Page 369 and 370: Appendix D Sample Passages, Questio
- Page 371 and 372:
appendix d: sample passages, questi
- Page 373 and 374:
20 appendix d: sample passages, que
- Page 375 and 376:
appendix d: sample passages, questi
- Page 377 and 378:
appendix d: sample passages, questi
- Page 379 and 380:
appendix d: sample passages, questi
- Page 381 and 382:
appendix d: sample passages, questi
- Page 383 and 384:
appendix d: sample passages, questi
- Page 385 and 386:
appendix d: sample passages, questi
- Page 387 and 388:
appendix d: sample passages, questi
- Page 389 and 390:
appendix d: sample passages, questi
- Page 391 and 392:
appendix d: sample passages, questi
- Page 393 and 394:
Questions Unbelievable Night append
- Page 395 and 396:
appendix d: sample passages, questi
- Page 397 and 398:
appendix d: sample passages, questi
- Page 399 and 400:
appendix d: sample passages, questi
- Page 401 and 402:
12 appendix d: sample passages, que
- Page 403 and 404:
14 Questions 6-9 are about the Pill
- Page 405 and 406:
16 Questions 11-13 are about the Wo
- Page 407 and 408:
appendix d: sample passages, questi
- Page 411 and 412:
Appendix E Item Descriptions Develo
- Page 413 and 414:
appendix e: reading items used for
- Page 415 and 416:
appendix e: reading items used for
- Page 417 and 418:
appendix e: reading items used for
- Page 419 and 420:
appendix e: reading items used for
- Page 421:
appendix e: reading items used for
- Page 424 and 425:
394 appendix f: iceland and norway
- Page 427 and 428:
Appendix G Organizations and Indivi
- Page 429 and 430:
appendix g: organizations and indiv
- Page 431 and 432:
appendix g: organizations and indiv
- Page 433 and 434:
appendix g: organizations and indiv
- Page 436 and 437:
TIMSS & PIRLS International Study C
- Page 439 and 440:
TIMSS & PIRLS International Study C
- Page 441 and 442:
TIMSS & PIRLS International Study C
- Page 443 and 444:
TIMSS & PIRLS International Study C
- Page 445:
TIMSS & PIRLS International Study C
- Page 448 and 449:
TIMSS & PIRLS International Study C
- Page 450 and 451:
TIMSS & PIRLS International Study C
- Page 453:
TIMSS & PIRLS International Study C


