

here - TIMSS and PIRLS Home - Boston College
here - TIMSS and PIRLS Home - Boston College
here - TIMSS and PIRLS Home - Boston College

You also want an ePaper? Increase the reach of your titles
YUMPU automatically turns print PDFs into web optimized ePapers that Google loves.
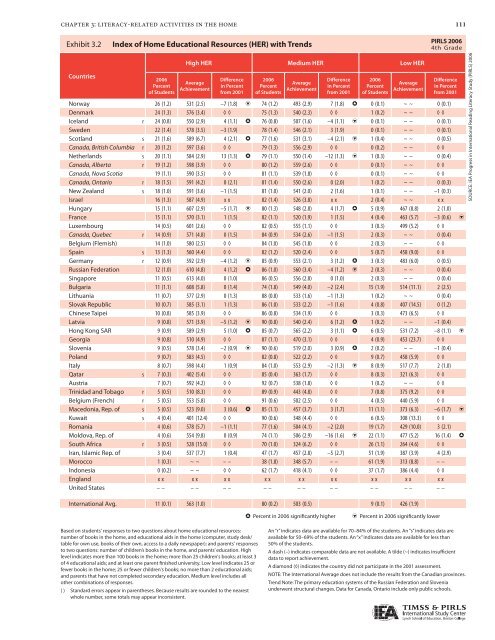
chapter 3: literacy-related activities in the home<br />
Exhibit 3.2: 3.2 Index Index of of <strong>Home</strong> Educational Resources (HER) (HER) with with Trends<br />
Countries<br />
2006<br />
Percent<br />
of Students<br />
High HER Medium HER Low HER<br />
Average<br />
Achievement<br />
Difference<br />
in Percent<br />
from 2001<br />
2006<br />
Percent<br />
of Students<br />
Average<br />
Achievement<br />
Difference<br />
in Percent<br />
from 2001<br />
2006<br />
Percent<br />
of Students<br />
Average<br />
Achievement<br />
Difference<br />
in Percent<br />
from 2001<br />
Norway 26 (1.2) 531 (2.5) –7 (1.8) i 74 (1.2) 493 (2.9) 7 (1.8) h 0 (0.1) ~ ~ 0 (0.1)<br />
Denmark 24 (1.3) 576 (3.4) ◊ ◊ 75 (1.3) 540 (2.3) ◊ ◊ 1 (0.2) ~ ~ ◊ ◊<br />
Icel<strong>and</strong> r 24 (0.8) 550 (2.9) 4 (1.1) h 76 (0.8) 507 (1.6) –4 (1.1) i 0 (0.1) ~ ~ 0 (0.1)<br />
Sweden 22 (1.4) 578 (3.5) –3 (1.9) 78 (1.4) 546 (2.1) 3 (1.9) 0 (0.1) ~ ~ 0 (0.1)<br />
Scotl<strong>and</strong> s 21 (1.6) 589 (6.7) 4 (2.1) h 77 (1.6) 531 (3.1) –4 (2.1) i 1 (0.4) ~ ~ 0 (0.5)<br />
Canada, British Columbia r 20 (1.2) 597 (3.6) ◊ ◊ 79 (1.3) 556 (2.9) ◊ ◊ 0 (0.2) ~ ~ ◊ ◊<br />
Netherl<strong>and</strong>s s 20 (1.1) 584 (2.9) 13 (1.3) h 79 (1.1) 550 (1.4) –12 (1.3) i 1 (0.3) ~ ~ 0 (0.4)<br />
Canada, Alberta r 19 (1.2) 598 (3.9) ◊ ◊ 80 (1.2) 559 (2.6) ◊ ◊ 0 (0.1) ~ ~ ◊ ◊<br />
Canada, Nova Scotia 19 (1.1) 590 (3.5) ◊ ◊ 81 (1.1) 539 (1.8) ◊ ◊ 0 (0.1) ~ ~ ◊ ◊<br />
Canada, Ontario r 18 (1.5) 591 (4.2) 0 (2.1) 81 (1.4) 550 (2.6) 0 (2.0) 1 (0.2) ~ ~ 0 (0.3)<br />
New Zeal<strong>and</strong> s 18 (1.0) 591 (3.6) –1 (1.5) 81 (1.0) 541 (2.0) 2 (1.6) 1 (0.1) ~ ~ –1 (0.3)<br />
Israel 16 (1.3) 587 (4.9) x x 82 (1.4) 526 (3.8) x x 2 (0.4) ~ ~ x x<br />
Hungary 15 (1.1) 607 (2.9) –5 (1.7) i 80 (1.3) 548 (2.8) 4 (1.7) h 5 (0.9) 467 (8.8) 2 (1.0)<br />
France 15 (1.1) 570 (3.1) 1 (1.5) 82 (1.1) 520 (1.9) 1 (1.5) 4 (0.4) 463 (5.7) –3 (0.6) i<br />
Luxembourg 14 (0.5) 601 (2.6) ◊ ◊ 82 (0.5) 555 (1.1) ◊ ◊ 3 (0.3) 499 (5.2) ◊ ◊<br />
Canada, Quebec r 14 (0.9) 571 (4.8) 0 (1.5) 84 (0.9) 534 (2.6) –1 (1.5) 2 (0.3) ~ ~ 0 (0.4)<br />
Belgium (Flemish) 14 (1.0) 580 (2.5) ◊ ◊ 84 (1.0) 545 (1.8) ◊ ◊ 2 (0.3) ~ ~ ◊ ◊<br />
Spain s 13 (1.3) 560 (4.4) ◊ ◊ 82 (1.2) 520 (2.4) ◊ ◊ 5 (0.7) 458 (9.0) ◊ ◊<br />
Germany r 12 (0.9) 592 (2.9) –4 (1.2) i 85 (0.9) 553 (2.1) 3 (1.2) h 3 (0.3) 483 (6.0) 0 (0.5)<br />
Russian Federation 12 (1.0) 610 (4.8) 4 (1.2) h 86 (1.0) 560 (3.4) –4 (1.2) i 2 (0.3) ~ ~ 0 (0.4)<br />
Singapore 11 (0.5) 613 (4.0) 0 (1.0) 86 (0.5) 556 (2.8) 0 (1.0) 2 (0.3) ~ ~ 0 (0.4)<br />
Bulgaria 11 (1.1) 608 (5.8) 0 (1.4) 74 (1.8) 549 (4.0) –2 (2.4) 15 (1.9) 514 (11.1) 2 (2.5)<br />
Lithuania 11 (0.7) 577 (2.9) 0 (1.3) 88 (0.8) 533 (1.6) –1 (1.3) 1 (0.2) ~ ~ 0 (0.4)<br />
Slovak Republic 10 (0.7) 585 (3.1) 1 (1.3) 86 (1.0) 533 (2.2) –1 (1.6) 4 (0.8) 407 (14.5) 0 (1.2)<br />
Chinese Taipei 10 (0.8) 585 (3.9) ◊ ◊ 86 (0.8) 534 (1.9) ◊ ◊ 3 (0.3) 473 (6.5) ◊ ◊<br />
Latvia 9 (0.8) 571 (3.9) –5 (1.2) i 90 (0.8) 540 (2.4) 6 (1.2) h 1 (0.2) ~ ~ –1 (0.4)<br />
Hong Kong SAR 9 (0.9) 589 (2.9) 5 (1.0) h 85 (0.7) 565 (2.2) 3 (1.1) h 6 (0.5) 531 (7.2) –8 (1.1) i<br />
Georgia 9 (0.8) 510 (4.9) ◊ ◊ 87 (1.1) 470 (3.1) ◊ ◊ 4 (0.9) 453 (23.7) ◊ ◊<br />
Slovenia 9 (0.5) 578 (3.4) –2 (0.9) i 90 (0.6) 519 (2.0) 3 (0.9) h 2 (0.2) ~ ~ –1 (0.4)<br />
Pol<strong>and</strong> 9 (0.7) 583 (4.5) ◊ ◊ 82 (0.8) 522 (2.2) ◊ ◊ 9 (0.7) 458 (5.9) ◊ ◊<br />
Italy 8 (0.7) 598 (4.4) 1 (0.9) 84 (1.0) 553 (2.9) –2 (1.3) i 8 (0.9) 517 (7.7) 2 (1.0)<br />
Qatar s 7 (0.3) 402 (5.4) ◊ ◊ 85 (0.4) 363 (1.7) ◊ ◊ 8 (0.3) 321 (6.3) ◊ ◊<br />
Austria 7 (0.7) 592 (4.2) ◊ ◊ 92 (0.7) 538 (1.8) ◊ ◊ 1 (0.2) ~ ~ ◊ ◊<br />
Trinidad <strong>and</strong> Tobago r 5 (0.5) 510 (8.3) ◊ ◊ 89 (0.9) 443 (4.8) ◊ ◊ 7 (0.8) 375 (9.2) ◊ ◊<br />
Belgium (French) r 5 (0.5) 553 (5.8) ◊ ◊ 91 (0.6) 502 (2.5) ◊ ◊ 4 (0.5) 440 (5.9) ◊ ◊<br />
Macedonia, Rep. of s 5 (0.5) 523 (9.0) 3 (0.6) h 85 (1.1) 457 (3.7) 3 (1.7) 11 (1.1) 373 (6.3) –6 (1.7) i<br />
Kuwait s 4 (0.4) 401 (12.4) ◊ ◊ 90 (0.6) 348 (4.4) ◊ ◊ 6 (0.5) 308 (13.3) ◊ ◊<br />
Romania 4 (0.6) 578 (5.7) –1 (1.1) 77 (1.6) 504 (4.1) –2 (2.0) 19 (1.7) 429 (10.0) 3 (2.1)<br />
Moldova, Rep. of 4 (0.6) 554 (9.8) 0 (0.9) 74 (1.1) 506 (2.9) –16 (1.6) i 22 (1.1) 477 (5.2) 16 (1.4) h<br />
South Africa r 3 (0.5) 528 (15.0) ◊ ◊ 70 (1.0) 324 (6.2) ◊ ◊ 26 (1.1) 264 (4.6) ◊ ◊<br />
Iran, Islamic Rep. of 3 (0.4) 537 (7.7) 1 (0.4) 47 (1.7) 457 (2.8) –5 (2.7) 51 (1.9) 387 (3.9) 4 (2.9)<br />
Morocco 1 (0.3) ~ ~ – – 38 (1.8) 348 (5.7) – – 61 (1.9) 313 (8.8) – –<br />
Indonesia 0 (0.2) ~ ~ ◊ ◊ 62 (1.7) 418 (4.1) ◊ ◊ 37 (1.7) 386 (4.4) ◊ ◊<br />
Engl<strong>and</strong> x x x x x x x x x x x x x x x x x x<br />
United States – – – – – – – – – – – – – – – – – –<br />
International Avg. 11 (0.1) 563 (1.0) 80 (0.2) 503 (0.5) 9 (0.1) 426 (1.9)<br />
Based on students' responses to two questions about home educational resources:<br />
number of books in the home, <strong>and</strong> educational aids in the home (computer, study desk/<br />
table for own use, books of their own, access to a daily newspaper); <strong>and</strong> parents' responses<br />
to two questions: number of children’s books in the home, <strong>and</strong> parents’ education. High<br />
level indicates more than 100 books in the home; more than 25 children's books; at least 3<br />
of 4 educational aids; <strong>and</strong> at least one parent finished university. Low level indicates 25 or<br />
fewer books in the home; 25 or fewer children's books; no more than 2 educational aids;<br />
<strong>and</strong> parents that have not completed secondary education. Medium level includes all<br />
other combinations of responses.<br />
( ) St<strong>and</strong>ard errors appear in parentheses. Because results are rounded to the nearest<br />
whole number, some totals may appear inconsistent.<br />
h Percent in 2006 significantly higher i Percent in 2006 significantly lower<br />
An “r” indicates data are available for 70–84% of the students. An “s” indicates data are<br />
available for 50–69% of the students. An “x” indicates data are available for less than<br />
50% of the students.<br />
A dash (–) indicates comparable data are not available. A tilde (~) indicates insufficient<br />
data to report achievement.<br />
A diamond (◊) indicates the country did not participate in the 2001 assessment.<br />
111<br />
<strong>PIRLS</strong> 2006<br />
4th Grade<br />
NOTE: The International Average does not include the results from the Canadian provinces.<br />
Trend Note: The primary education systems of the Russian Federation <strong>and</strong> Slovenia<br />
underwent structural changes. Data for Canada, Ontario include only public schools.<br />
SOURCE: IEA Progress in International Reading Literacy Study (<strong>PIRLS</strong>) 2006


