Biological Opinions - Bureau of Reclamation
Biological Opinions - Bureau of Reclamation
Biological Opinions - Bureau of Reclamation

Create successful ePaper yourself
Turn your PDF publications into a flip-book with our unique Google optimized e-Paper software.
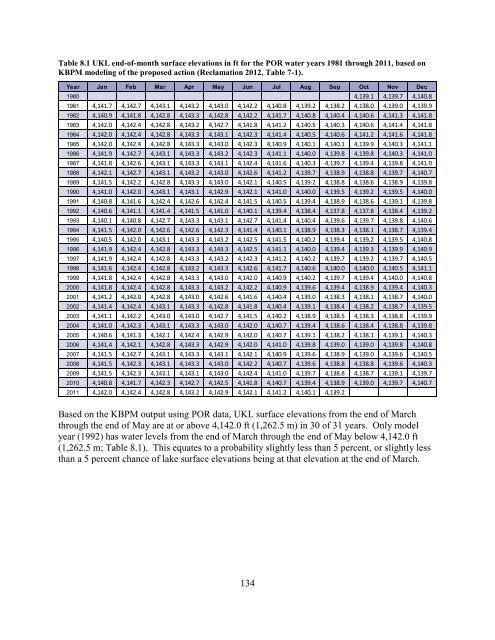
Table 8.1 UKL end-<strong>of</strong>-month surface elevations in ft for the POR water years 1981 through 2011, based on<br />
KBPM modeling <strong>of</strong> the proposed action (<strong>Reclamation</strong> 2012, Table 7-1).<br />
Year Jan Feb Mar Apr May Jun Jul Aug Sep Oct Nov Dec<br />
1980 4,139.1 4,139.7 4,140.8<br />
1981 4,141.7 4,142.7 4,143.1 4,143.2 4,143.0 4,142.2 4,140.8 4,139.2 4,138.2 4,138.0 4,139.0 4,139.9<br />
1982 4,140.9 4,141.8 4,142.8 4,143.3 4,142.8 4,142.2 4,141.7 4,140.8 4,140.4 4,140.6 4,141.3 4,141.8<br />
1983 4,142.0 4,142.4 4,142.8 4,143.2 4,142.7 4,141.8 4,141.2 4,140.5 4,140.3 4,140.6 4,141.4 4,141.8<br />
1984 4,142.0 4,142.4 4,142.8 4,143.3 4,143.1 4,142.3 4,141.4 4,140.5 4,140.6 4,141.2 4,141.6 4,141.8<br />
1985 4,142.0 4,142.4 4,142.8 4,143.3 4,143.0 4,142.3 4,140.9 4,140.1 4,140.1 4,139.9 4,140.3 4,141.1<br />
1986 4,141.9 4,142.7 4,143.1 4,143.3 4,143.2 4,142.3 4,141.1 4,140.0 4,139.8 4,139.8 4,140.3 4,141.0<br />
1987 4,141.8 4,142.6 4,143.1 4,143.3 4,143.1 4,142.4 4,141.6 4,140.3 4,139.7 4,139.4 4,139.8 4,141.0<br />
1988 4,142.1 4,142.7 4,143.1 4,143.2 4,143.0 4,142.6 4,141.2 4,139.7 4,138.9 4,138.8 4,139.7 4,140.7<br />
1989 4,141.5 4,142.2 4,142.8 4,143.3 4,143.0 4,142.1 4,140.5 4,139.2 4,138.8 4,138.6 4,138.9 4,139.8<br />
1990 4,141.0 4,142.0 4,143.1 4,143.1 4,142.9 4,142.1 4,141.0 4,140.0 4,139.5 4,139.2 4,139.5 4,140.0<br />
1991 4,140.8 4,141.6 4,142.4 4,142.6 4,142.4 4,141.5 4,140.5 4,139.4 4,138.9 4,138.6 4,139.1 4,139.8<br />
1992 4,140.6 4,141.1 4,141.4 4,141.5 4,141.0 4,140.1 4,139.4 4,138.4 4,137.8 4,137.8 4,138.4 4,139.2<br />
1993 4,140.1 4,140.8 4,142.7 4,143.3 4,143.1 4,142.7 4,141.4 4,140.4 4,139.6 4,139.7 4,139.8 4,140.6<br />
1994 4,141.5 4,142.0 4,142.6 4,142.6 4,142.3 4,141.4 4,140.1 4,138.9 4,138.3 4,138.1 4,138.7 4,139.4<br />
1995 4,140.5 4,142.0 4,143.1 4,143.3 4,143.2 4,142.5 4,141.5 4,140.2 4,139.4 4,139.2 4,139.5 4,140.8<br />
1996 4,141.9 4,142.4 4,142.8 4,143.3 4,143.3 4,142.5 4,141.1 4,140.0 4,139.4 4,139.3 4,139.9 4,140.9<br />
1997 4,141.9 4,142.4 4,142.8 4,143.3 4,143.2 4,142.3 4,141.2 4,140.2 4,139.7 4,139.2 4,139.7 4,140.5<br />
1998 4,141.6 4,142.4 4,142.8 4,143.2 4,143.3 4,142.6 4,141.7 4,140.6 4,140.0 4,140.0 4,140.5 4,141.1<br />
1999 4,141.8 4,142.4 4,142.8 4,143.3 4,143.0 4,142.0 4,140.9 4,140.2 4,139.7 4,139.4 4,140.0 4,140.8<br />
2000 4,141.8 4,142.4 4,142.8 4,143.3 4,143.2 4,142.2 4,140.9 4,139.6 4,139.4 4,138.9 4,139.4 4,140.3<br />
2001 4,141.2 4,142.0 4,142.8 4,143.0 4,142.6 4,141.6 4,140.4 4,139.0 4,138.3 4,138.1 4,138.7 4,140.0<br />
2002 4,141.4 4,142.4 4,143.1 4,143.3 4,142.8 4,141.8 4,140.4 4,139.1 4,138.4 4,138.2 4,138.7 4,139.5<br />
2003 4,141.1 4,142.2 4,143.0 4,143.0 4,142.7 4,141.5 4,140.2 4,138.9 4,138.5 4,138.3 4,138.8 4,139.9<br />
2004 4,141.0 4,142.3 4,143.1 4,143.3 4,143.0 4,142.0 4,140.7 4,139.4 4,138.6 4,138.4 4,138.8 4,139.8<br />
2005 4,140.6 4,141.3 4,142.1 4,142.4 4,142.9 4,142.0 4,140.7 4,139.1 4,138.2 4,138.1 4,139.1 4,140.3<br />
2006 4,141.4 4,142.1 4,142.8 4,143.3 4,142.9 4,142.0 4,141.0 4,139.8 4,139.0 4,139.0 4,139.8 4,140.8<br />
2007 4,141.5 4,142.7 4,143.1 4,143.3 4,143.1 4,142.1 4,140.9 4,139.6 4,138.9 4,139.0 4,139.6 4,140.5<br />
2008 4,141.5 4,142.3 4,143.1 4,143.3 4,143.0 4,142.2 4,140.7 4,139.6 4,138.8 4,138.8 4,139.6 4,140.3<br />
2009 4,141.5 4,142.3 4,143.1 4,143.1 4,143.0 4,142.4 4,141.0 4,139.7 4,138.8 4,138.7 4,139.1 4,139.7<br />
2010 4,140.8 4,141.7 4,142.3 4,142.7 4,142.5 4,141.8 4,140.7 4,139.4 4,138.9 4,139.0 4,139.7 4,140.7<br />
2011 4,142.0 4,142.4 4,142.8 4,143.2 4,142.9 4,142.1 4,141.2 4,140.1 4,139.2<br />
Based on the KBPM output using POR data, UKL surface elevations from the end <strong>of</strong> March<br />
through the end <strong>of</strong> May are at or above 4,142.0 ft (1,262.5 m) in 30 <strong>of</strong> 31 years. Only model<br />
year (1992) has water levels from the end <strong>of</strong> March through the end <strong>of</strong> May below 4,142.0 ft<br />
(1,262.5 m; Table 8.1). This equates to a probability slightly less than 5 percent, or slightly less<br />
than a 5 percent chance <strong>of</strong> lake surface elevations being at that elevation at the end <strong>of</strong> March.<br />
134