- Page 1 and 2:
National Marine Fisheries Service U
- Page 3 and 4:
7.4.5 LRS and SNS Population Dynami
- Page 5 and 6:
11.1.5 Critical Assumptions .......
- Page 7 and 8:
16 APPENDICIES ....................
- Page 9 and 10:
Table 8.2 UKL end-of-month elevatio
- Page 11 and 12:
LIST OF FIGURES Figure 3.1. The act
- Page 13 and 14:
Figure 11.17. Coho salmon fry habit
- Page 15 and 16:
ABBREVIATIONS AND ACRONYMS Abbrevia
- Page 17 and 18:
Abbreviation/Acronym YTEP WDFW WRIM
- Page 19 and 20:
In 2001, the Services issued BiOps
- Page 21 and 22:
Findings of Fact and Order of Deter
- Page 23 and 24:
proposed changes to the vegetation
- Page 25 and 26:
Figure 3.1. The action area for Rec
- Page 27 and 28:
4 PROPOSED ACTION Reclamation propo
- Page 29 and 30:
4.2 Element Two Operate the Project
- Page 31 and 32:
October 1 and March 1. The proposed
- Page 33 and 34:
Reclamation incorporated the 1981 t
- Page 35 and 36:
Provide Project irrigation deliveri
- Page 37 and 38:
Table 4.3. UKL fill rate adjustment
- Page 39 and 40:
Table 4.5. Calculation of fall/wint
- Page 41 and 42:
Flows below IGD are ultimately the
- Page 43 and 44:
The EWA, Project Supply, and UKL Re
- Page 45 and 46:
Table 4.8. Environmental Water Acco
- Page 47 and 48:
eleases somewhat on the ascending l
- Page 49 and 50:
fish disease, die off, entrainment,
- Page 51 and 52:
acre-feet when the Project Supply c
- Page 53 and 54:
Table 4.11. Monthly maximum Lower K
- Page 55 and 56:
4.2.4 Ramp-Down Rates at Iron Gate
- Page 57 and 58:
progresses and EWA volumes are upda
- Page 59 and 60:
O&M activities are carried out eith
- Page 61 and 62:
1. The A Canal has six headgates th
- Page 63 and 64:
Therefore, Reclamation proposes to
- Page 65 and 66:
coordinate with the NMFS to develop
- Page 67 and 68:
the confluence with Omogar Creek at
- Page 69 and 70:
though several major improvements t
- Page 71 and 72:
Sucker larvae transform into age-0
- Page 73 and 74:
units: (1) Clear Lake; (2) Tule Lak
- Page 75 and 76:
Figure 7.2. Adult spawning populati
- Page 77 and 78:
Table 7.1. Estimated LRS and SNS ad
- Page 79 and 80:
1905, Ch. 567, 33 Stat. 714). The P
- Page 81 and 82:
Figure 7.4 Modeled April through No
- Page 83 and 84:
7.9.2 Klamath Basin The Oregon Clim
- Page 85 and 86:
A change in mean precipitation rang
- Page 87 and 88:
Table 7.2 Impaired water bodies wit
- Page 89 and 90:
Table 7.3 Seasonal comparisons of p
- Page 91 and 92:
ammonia that is lethal to 50 percen
- Page 93 and 94:
Table 7.4 Estimated external phosph
- Page 95 and 96:
examination of juvenile suckers fro
- Page 97 and 98:
Evaluation of baseline hydrology in
- Page 99 and 100:
2012 1931 through 2012 12.6% 0.24 5
- Page 101 and 102:
The overall water year trend (Table
- Page 103 and 104:
Figure 7.7 Sprague River trends, wa
- Page 105 and 106:
Figure 7.9 Sprague River trends, wa
- Page 107 and 108:
Figure 7.12 Williamson River trends
- Page 109 and 110:
Figure 7.14 UKL trends, water years
- Page 111 and 112:
Figure 7.17 UKL: net inflow departu
- Page 113 and 114:
7.10.3.3 Competition and Predation
- Page 115 and 116:
By late July, surviving larval suck
- Page 117 and 118:
Threat Nature of Threat Life Stage
- Page 119 and 120:
2011) and increased adult spawning
- Page 121 and 122:
Based on the best available informa
- Page 123 and 124:
contrast, water levels began 1.5 ft
- Page 125 and 126:
evaporation and seepage estimated a
- Page 127 and 128:
prolonged low oxygen conditions if
- Page 129 and 130:
The April through September 4,034.6
- Page 131 and 132:
8 EFFECTS OF THE ACTION ON LOST RIV
- Page 133 and 134:
Although the volume of Project wate
- Page 135 and 136:
than 1 m), and fitting one or more
- Page 137 and 138:
Figure 8.3. UKL elevations at the e
- Page 139 and 140:
Services and Reclamation will deter
- Page 141 and 142:
For cumulative net inflow values be
- Page 143 and 144:
Figure 8.8. UKL elevations at the e
- Page 145 and 146:
Figure 8.10. UKL elevations at the
- Page 147 and 148:
Figure 8.12. UKL elevations at the
- Page 149 and 150:
natural and man-caused changes in i
- Page 151 and 152:
Table 8.1 UKL end-of-month surface
- Page 153 and 154:
UKL. Based on best available inform
- Page 155 and 156:
larvae in UKL. Annual production of
- Page 157 and 158:
Table 8.5 UKL end-of-month elevatio
- Page 159 and 160:
Based on our review of the literatu
- Page 161 and 162:
into the Pelican Bay water quality
- Page 163 and 164:
We assume that UKL surface elevatio
- Page 165 and 166:
vary by several orders of magnitude
- Page 167 and 168:
survival rates, we know that some o
- Page 169 and 170:
populations, and contains the large
- Page 171 and 172:
8.3.5.1 Effects to Adult Sucker Spa
- Page 173 and 174:
Table 8.8 Clear Lake surface elevat
- Page 175 and 176:
occur, especially in the west lobe.
- Page 177 and 178:
Table 8.9 End of the month surface
- Page 179 and 180:
8.3.7.4 Effects of Entrainment Loss
- Page 181 and 182:
The source of the sediment is unkno
- Page 183 and 184:
period when they migrate upstream t
- Page 185 and 186:
limited LRS and SNS persistence in
- Page 187 and 188:
term and localized and because fish
- Page 189 and 190:
8.5.1 Canal Salvage Reclamation pro
- Page 191 and 192:
high predation rates and failure of
- Page 193 and 194:
include the Klamath Basin Rangeland
- Page 195 and 196:
Figure 9.1 Designated CHUs for the
- Page 197 and 198:
These are discussed in greater deta
- Page 199 and 200:
The proposed action will have no ef
- Page 201 and 202:
No other spawning habitat exists be
- Page 203 and 204:
consulted on. Current monitoring da
- Page 205 and 206:
proposed action and this PCE suppor
- Page 207 and 208:
Because of a multi-decade lack of r
- Page 209 and 210:
Adverse effects of the proposed act
- Page 211 and 212:
that juvenile survival is most like
- Page 213 and 214:
elocation effort in Lake Ewauna to
- Page 215 and 216:
LRS and SNS population resiliency o
- Page 217 and 218:
stratum 4 (Interior Klamath) in whi
- Page 219 and 220:
Pacific salmonids Oncorhynchus spp.
- Page 221 and 222:
scenario, actions and elements of t
- Page 223 and 224:
flow prescriptions should mimic pro
- Page 225 and 226:
11.2.1 Current Condition of Critica
- Page 227 and 228:
11.2.2 Factors Affecting SONCC Coho
- Page 229 and 230:
e disoriented or displaced downstre
- Page 231 and 232:
enhancement, and rehabilitative act
- Page 233 and 234:
Water Temperature Sedimentation Org
- Page 235 and 236:
Figure 11.1 Longitudinal and season
- Page 237 and 238:
functioning floodplains that fail t
- Page 239 and 240:
downstream of IGD, (2) enhance coho
- Page 241 and 242:
few local ranchers and water distri
- Page 243 and 244:
in some tributaries, access to and
- Page 245 and 246:
11.3.7 Summary of Critical Habitat
- Page 247 and 248:
these two time periods, the effects
- Page 249 and 250:
consists of approximately 29,000 ac
- Page 251 and 252:
The PacifiCorp habitat conservation
- Page 253 and 254:
IGD, or used in constructed habitat
- Page 255 and 256:
estoration, watershed planning, sal
- Page 257 and 258:
Table 11.4. Modeled suspended sedim
- Page 259 and 260:
parasites Ceratomyxa shasta (causes
- Page 261 and 262:
that become infected is estimated t
- Page 263 and 264:
where snow water equivalent is proj
- Page 265 and 266:
minimizing disease risks, the detai
- Page 267 and 268:
Figure 11.4. Proposed action, histo
- Page 269 and 270:
Figure 11.6. Proposed action weekly
- Page 271 and 272:
Figure 11.9. Regression between EWA
- Page 273 and 274:
Figure 11.11. Proposed action and o
- Page 275 and 276:
Figure 11.12. Number of days per wa
- Page 277 and 278:
Figure 11.14. Monthly coefficient o
- Page 279 and 280:
IGD. The proposed action modeled da
- Page 281 and 282:
The results from Table 11.7 indicat
- Page 283 and 284:
likely to increase the quantity of
- Page 285 and 286:
habitat decreases between the Shast
- Page 287 and 288:
Table 11.9. Daily average mainstem
- Page 289 and 290:
Table 11.10. Daily average mainstem
- Page 291 and 292:
5% 3336 13176 27664 26168 30946 237
- Page 293 and 294:
The proposed action results in agri
- Page 295 and 296:
Figure 11.21. Monthly mean of daily
- Page 297 and 298:
Riparian restoration projects will
- Page 299 and 300:
expected to be typical riparian spe
- Page 301 and 302:
Table 11.13. Annual percent of proj
- Page 303 and 304:
esource needs as they grow, and 3)
- Page 305 and 306:
11.5.2 Klamath River Basin Adjudica
- Page 307 and 308:
coho salmon within the Klamath Rive
- Page 309 and 310:
aspects of a natural flow regime th
- Page 311 and 312:
element of coho salmon critical hab
- Page 313 and 314:
12.1.1.1 Risk Analyses for Endanger
- Page 315 and 316:
ESU DIVERSITY STRATA POPULATIONS IN
- Page 317 and 318:
eproduction, and distribution. The
- Page 319 and 320:
Figure 12.2. Historic population st
- Page 321 and 322:
the average ratio of IP-km to total
- Page 323 and 324:
Although long-term data on coho sal
- Page 325 and 326:
1980 1981 1982 1983 1984 1985 1986
- Page 327 and 328:
maintain viable abundances in many
- Page 329 and 330:
12.2.5.5 Viability Summary Though p
- Page 331 and 332:
coastal currents and upwelling, kno
- Page 333 and 334:
12.2.6.2 Marine Derived Nutrients M
- Page 335 and 336:
fisheries south of Cape Falcon, Ore
- Page 337 and 338:
12.3 Environmental Baseline of Coho
- Page 339 and 340:
water temperatures up to 19 ºC in
- Page 341 and 342:
some coho salmon smolts may stop mi
- Page 343 and 344:
threshold, all Klamath River coho s
- Page 345 and 346:
abundance threshold (Table 12.3). T
- Page 347 and 348:
mainstem Klamath and Trinity rivers
- Page 349 and 350:
Although there are risks to Klamath
- Page 351 and 352:
activities are generally beneficial
- Page 353 and 354:
12.4 Effects to Individuals The pro
- Page 355 and 356:
12.4.1.2 Response 12.4.1.2.1 Adults
- Page 357 and 358:
(2012) believes is representative o
- Page 359 and 360:
genotype II density of 5 spores/L w
- Page 361 and 362:
flows provide a limit to the increa
- Page 363 and 364:
polychaete and sediment disturbance
- Page 365 and 366:
which will likely result in a relat
- Page 367 and 368:
etween Trees of Heaven (RM 172) and
- Page 369 and 370:
action. Reclamation estimated that
- Page 371 and 372:
Based on literature, increased comp
- Page 373 and 374:
Table 12.6. Summary of risks result
- Page 375 and 376:
most juveniles. Stream flow diversi
- Page 377 and 378:
at most fish relocation sites, base
- Page 379 and 380:
higher, the minimally increased sed
- Page 381 and 382:
Small pulses of moderately turbid w
- Page 383 and 384:
Boulder faces in the deflector stru
- Page 385 and 386:
conditions may fail if those condit
- Page 387 and 388:
Adverse effects of the proposed act
- Page 389 and 390:
Potential Stressor Habitat Reductio
- Page 391 and 392:
Potential Stressor Elevated water t
- Page 393 and 394:
12.6.2 Effects of fitness consequen
- Page 395 and 396:
13 INCIDENTAL TAKE STATEMENT Sectio
- Page 397 and 398:
Table 13.1 Summary of maximum annua
- Page 399 and 400:
in fewer larvae and juveniles, and
- Page 401 and 402:
Table 13.2 Estimated annual maximum
- Page 403 and 404:
1.2.1.8. Incidental Take Caused by
- Page 405 and 406:
characteristics of aquatic species,
- Page 407 and 408:
Table 13.5 Expected annual Environm
- Page 409 and 410:
Cause of Incidental Take Habitat Re
- Page 411 and 412:
Clear Lake, Gerber Reservoir, and T
- Page 413 and 414:
This term and condition is requirin
- Page 415 and 416:
13.4 Mandatory Monitoring and Repor
- Page 417 and 418:
Required hydrologic monitoring incl
- Page 419 and 420:
Table 13.7. Summary of LRS and SNS
- Page 421 and 422:
T&C or Mandatory Monitoring Mandato
- Page 423 and 424:
Table 13.9 Summary of reporting and
- Page 425 and 426:
Table 13.10 Summary of meetings req
- Page 427 and 428:
the above QA/QC procedures describe
- Page 429 and 430:
Barry, P.M., E.C. Janney, D.A. Hewi
- Page 431 and 432:
Burdick, S.M. and J. Rasmussen. 201
- Page 433 and 434:
Dunsmoor, L., L. Basdekas, B. Wood,
- Page 435 and 436:
Garen, D. 2011, Upper Klamath Basin
- Page 437 and 438:
Janney, E.C., B.S. Hayes, D.A. Hewi
- Page 439 and 440:
Laenen, A., and A.P. LeTourneau. 19
- Page 441 and 442:
Miller, R.R., and G.R. Smith. 1981.
- Page 443 and 444:
Perkins, D.L., and G.G. Scoppettone
- Page 445 and 446:
(Deltistes luxatus) in Tule and Cle
- Page 447 and 448:
Terwilliger, M. 2006. Physical habi
- Page 449 and 450:
USBR [U.S. Bureau of Reclamation].
- Page 451 and 452:
Williams, J.E. 2000. Chapter 13. Th
- Page 453 and 454:
Arthington, A.H., S.E. Bunn, N.L. P
- Page 455 and 456:
Beeman, J., S. Juhnke, G. Stutzer a
- Page 457 and 458: Brommer, J.E. 2000. The evolution o
- Page 459 and 460: Department of the Army Regional Gen
- Page 461 and 462: Chilcote, M. W. 2003. Relationship
- Page 463 and 464: Dunsmoor LK, and Huntington CW. 200
- Page 465 and 466: Foott, J.S., R. Stone, E. Wiseman,
- Page 467 and 468: Habera, J.W., R.J. Strange, B.D. Ca
- Page 469 and 470: Hemstreet, T. 2013. Electronic mail
- Page 471 and 472: Jordan, M. S. 2012. Hydraulic predi
- Page 473 and 474: Kostow, K. E., A. R. Marshall and S
- Page 475 and 476: MacFarlane, R. B., S. Hayes, and B.
- Page 477 and 478: Moyle, P. B. 2002. Inland Fishes of
- Page 479 and 480: PacifiCorp Klamath Hydroelectric Pr
- Page 481 and 482: Oregon Department of Environmental
- Page 483 and 484: Puckridge, J. T., F. Sheldon, K. F.
- Page 485 and 486: Ring, T.E. and B. Watson. 1999. Eff
- Page 487 and 488: Sommer, T. R., M. L. Nobriga, W. C.
- Page 489 and 490: Taylor, R. 1991. A review of local
- Page 491 and 492: USFWS [U. S. Fish and Wildlife Serv
- Page 493 and 494: Ward G, and Armstrong N. 2010. Asse
- Page 495 and 496: Winker, K., J. H. Rappole, and M. A
- Page 497 and 498: 77 FR 476. National Marine Fisherie
- Page 499 and 500: UKL Elevation (feet) Active Storage
- Page 501 and 502: UKL Elevation (feet) Active Storage
- Page 503 and 504: UKL Elevation (feet) Active Storage
- Page 505 and 506: 16.2 Appendix B: Elevation Flow Dat
- Page 507: 490
- Page 511 and 512: Week of Water Year 1992 1993 1994 1
- Page 513 and 514: Week of Water Year 2001 2002 2003 2
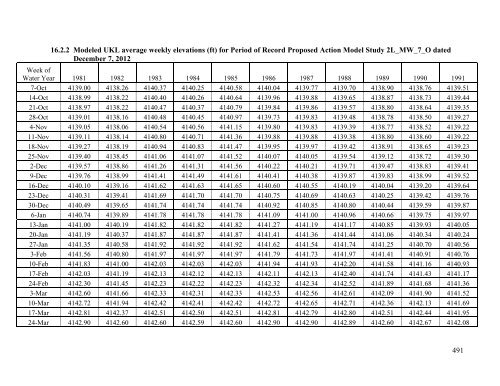
- Page 515 and 516: Week of Water Year 1981 1982 1983 1
- Page 517 and 518: Week of Water Year 1998 1999 2000 2
- Page 519 and 520: Week of Water Year 1981 1982 1983 1
- Page 521 and 522: Week of Water Year 1998 1999 2000 2
- Page 523 and 524: Week of Water Year 1981 1982 1983 1
- Page 525 and 526: Week of Water Year 1998 1999 2000 2
- Page 527 and 528: Water Year October November Decembe
- Page 529 and 530: Water Year October November Decembe
- Page 531 and 532: Water Year October November Decembe
- Page 533 and 534: 16.3 Appendix C: Description of Res
- Page 535 and 536: 4. Removal of Small Dams (permanent
- Page 537 and 538: Information regarding consideration
- Page 539 and 540: 9. Piping Ditches a. Project Descri
- Page 541 and 542: . Site-Specific Restrictions Restri
- Page 543 and 544: 6. Protection Measures The followin
- Page 545 and 546: to enter or be placed where they co
- Page 547 and 548: shall be distributed throughout the
- Page 549 and 550: weed free straw, silt fences) are i
- Page 551 and 552: the project is located, and compris
- Page 553 and 554: 2. Post Construction Monitoring and
- Page 555 and 556: Median Seasonal Flow (acre-feet) Me
- Page 557 and 558: Median Seasonal Flow (acre-feet) Me
- Page 559 and 560:
Median Seasonal Flow (acre-feet) Me
- Page 561 and 562:
Median Seasonal Flow (acre-feet) Me
- Page 563 and 564:
Median Seasonal Flow (acre-feet) Me
- Page 565 and 566:
Median Seasonal Flow (acre-feet) Me
- Page 567 and 568:
Median Seasonal Flow (acre-feet) Me
- Page 569 and 570:
Median Seasonal Flow (acre-feet) Me
- Page 571 and 572:
Median Seasonal Flow (acre-feet) Me
- Page 573 and 574:
Median Seasonal Flow (acre-feet) Me
- Page 575 and 576:
Median Seasonal Flow (acre-feet) Me
- Page 577 and 578:
Median Seasonal Flow (acre-feet) Me
- Page 579 and 580:
Median Seasonal Flow (acre-feet) Me
- Page 581 and 582:
Median Seasonal Flow (acre-feet) Me
- Page 583 and 584:
Median Seasonal Flow (acre-feet) Me
- Page 585 and 586:
Median Seasonal Flow (acre-feet) Me
- Page 587 and 588:
Median Seasonal Flow (acre-feet) Me
- Page 589 and 590:
Median Seasonal Flow (acre-feet) Me
- Page 591 and 592:
Median Seasonal Net Inflow (acre-fe
- Page 593 and 594:
Median Seasonal Net Inflow (acre-fe
- Page 595 and 596:
Median Seasonal Net Inflow (acre-fe
- Page 597 and 598:
16.5 Appendix E: Observed and Model
- Page 599 and 600:
Observed and modeled proposed actio
- Page 601 and 602:
Observed and modeled proposed actio
- Page 603 and 604:
16.6 Appendix F: Analyzing the rela
- Page 605 and 606:
Table 1. Paired comparison of the c
- Page 607:
Table 3. The difference in the mean