Assisting the older driver - SWOV
Assisting the older driver - SWOV
Assisting the older driver - SWOV

Create successful ePaper yourself
Turn your PDF publications into a flip-book with our unique Google optimized e-Paper software.
<strong>Assisting</strong> <strong>the</strong> <strong>older</strong> <strong>driver</strong><br />
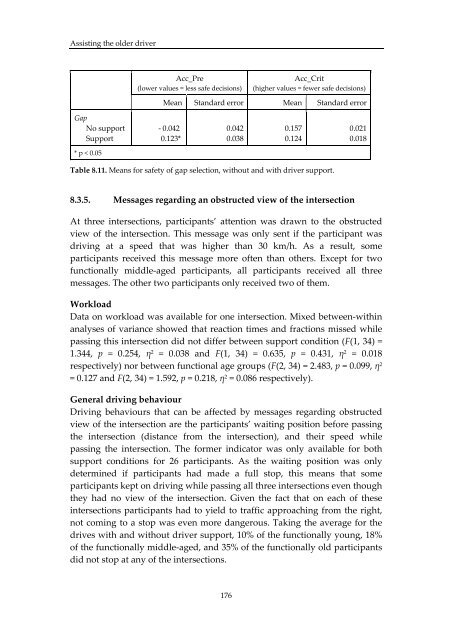
Acc_Pre<br />
(lower values = less safe decisions)<br />
Acc_Crit<br />
(higher values = fewer safe decisions)<br />
Mean Standard error Mean Standard error<br />
Gap<br />
No support<br />
Support<br />
‐ 0.042<br />
0.123*<br />
0.042<br />
0.038<br />
0.157<br />
0.124<br />
0.021<br />
0.018<br />
* p < 0.05<br />
Table 8.11. Means for safety of gap selection, without and with <strong>driver</strong> support.<br />
8.3.5. Messages regarding an obstructed view of <strong>the</strong> intersection<br />
At three intersections, participants’ attention was drawn to <strong>the</strong> obstructed<br />
view of <strong>the</strong> intersection. This message was only sent if <strong>the</strong> participant was<br />
driving at a speed that was higher than 30 km/h. As a result, some<br />
participants received this message more often than o<strong>the</strong>rs. Except for two<br />
functionally middle‐aged participants, all participants received all three<br />
messages. The o<strong>the</strong>r two participants only received two of <strong>the</strong>m.<br />
Workload<br />
Data on workload was available for one intersection. Mixed between‐within<br />
analyses of variance showed that reaction times and fractions missed while<br />
passing this intersection did not differ between support condition (F(1, 34) =<br />
1.344, p = 0.254, η 2 = 0.038 and F(1, 34) = 0.635, p = 0.431, η 2 = 0.018<br />
respectively) nor between functional age groups (F(2, 34) = 2.483, p = 0.099, η 2<br />
= 0.127 and F(2, 34) = 1.592, p = 0.218, η 2 = 0.086 respectively).<br />
General driving behaviour<br />
Driving behaviours that can be affected by messages regarding obstructed<br />
view of <strong>the</strong> intersection are <strong>the</strong> participants’ waiting position before passing<br />
<strong>the</strong> intersection (distance from <strong>the</strong> intersection), and <strong>the</strong>ir speed while<br />
passing <strong>the</strong> intersection. The former indicator was only available for both<br />
support conditions for 26 participants. As <strong>the</strong> waiting position was only<br />
determined if participants had made a full stop, this means that some<br />
participants kept on driving while passing all three intersections even though<br />
<strong>the</strong>y had no view of <strong>the</strong> intersection. Given <strong>the</strong> fact that on each of <strong>the</strong>se<br />
intersections participants had to yield to traffic approaching from <strong>the</strong> right,<br />
not coming to a stop was even more dangerous. Taking <strong>the</strong> average for <strong>the</strong><br />
drives with and without <strong>driver</strong> support, 10% of <strong>the</strong> functionally young, 18%<br />
of <strong>the</strong> functionally middle‐aged, and 35% of <strong>the</strong> functionally old participants<br />
did not stop at any of <strong>the</strong> intersections.<br />
176