Assisting the older driver - SWOV
Assisting the older driver - SWOV
Assisting the older driver - SWOV

Create successful ePaper yourself
Turn your PDF publications into a flip-book with our unique Google optimized e-Paper software.
Effects of a <strong>driver</strong> support system on workload and driving performance<br />
For those that did stop, waiting position did not differ between support<br />
conditions (F(1, 23) = 0.409, p = 0.529, η 2 = 0.017). Looking at all participants –<br />
those that did and did not stop – driving speed on <strong>the</strong> intersection tended to<br />
be lower (1.39 km/h) when driving with <strong>the</strong> support system installed than<br />
when driving without <strong>the</strong> support system installed (F(1, 36) = 3.886, p = 0.056,<br />
η 2 = 0.097). Differences between age groups were not significant, nei<strong>the</strong>r for<br />
driving speed nor for waiting position.<br />
Safety of decisions<br />
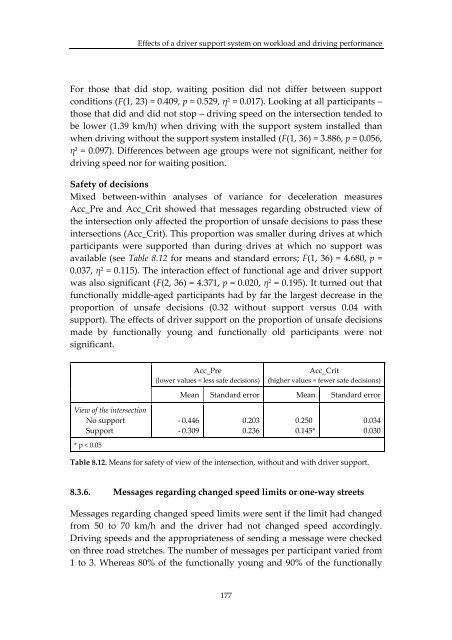
Mixed between‐within analyses of variance for deceleration measures<br />
Acc_Pre and Acc_Crit showed that messages regarding obstructed view of<br />
<strong>the</strong> intersection only affected <strong>the</strong> proportion of unsafe decisions to pass <strong>the</strong>se<br />
intersections (Acc_Crit). This proportion was smaller during drives at which<br />
participants were supported than during drives at which no support was<br />
available (see Table 8.12 for means and standard errors; F(1, 36) = 4.680, p =<br />
0.037, η 2 = 0.115). The interaction effect of functional age and <strong>driver</strong> support<br />
was also significant (F(2, 36) = 4.371, p = 0.020, η 2 = 0.195). It turned out that<br />
functionally middle‐aged participants had by far <strong>the</strong> largest decrease in <strong>the</strong><br />
proportion of unsafe decisions (0.32 without support versus 0.04 with<br />
support). The effects of <strong>driver</strong> support on <strong>the</strong> proportion of unsafe decisions<br />
made by functionally young and functionally old participants were not<br />
significant.<br />
Acc_Pre<br />
(lower values = less safe decisions)<br />
Acc_Crit<br />
(higher values = fewer safe decisions)<br />
Mean Standard error Mean Standard error<br />
View of <strong>the</strong> intersection<br />
No support<br />
Support<br />
‐ 0.446<br />
‐ 0.309<br />
0.203<br />
0.236<br />
0.250<br />
0.145*<br />
0.034<br />
0.030<br />
* p < 0.05<br />
Table 8.12. Means for safety of view of <strong>the</strong> intersection, without and with <strong>driver</strong> support.<br />
8.3.6. Messages regarding changed speed limits or one‐way streets<br />
Messages regarding changed speed limits were sent if <strong>the</strong> limit had changed<br />
from 50 to 70 km/h and <strong>the</strong> <strong>driver</strong> had not changed speed accordingly.<br />
Driving speeds and <strong>the</strong> appropriateness of sending a message were checked<br />
on three road stretches. The number of messages per participant varied from<br />
1 to 3. Whereas 80% of <strong>the</strong> functionally young and 90% of <strong>the</strong> functionally<br />
177