- Page 1 and 2: Assisting the older driver Intersec
- Page 3 and 4: SWOV‐Dissertatiereeks, Leidschend
- Page 5 and 6: Promotor: Copromotor: Beoordelingsc
- Page 7 and 8: 3.2.3. Conclusions regarding future
- Page 9 and 10: 7.3. Preconditions for safe use of
- Page 12 and 13: General introduction General introd
- Page 14 and 15: General introduction is answered by
- Page 16 and 17: Current state of the art: crashes a
- Page 18 and 19: Current state of the art: crashes a
- Page 20 and 21: Current state of the art: crashes a
- Page 22 and 23: Current state of the art: crashes a
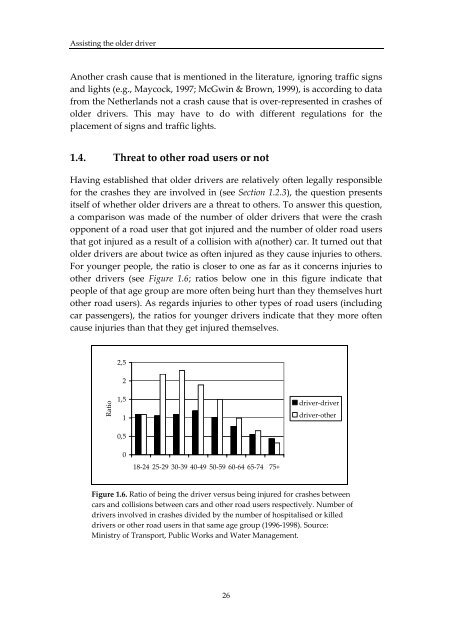
- Page 24 and 25: Current state of the art: crashes a
- Page 28 and 29: Current state of the art: crashes a
- Page 30 and 31: Current state of the art: crashes a
- Page 32 and 33: Current state of the art: crashes a
- Page 34 and 35: Current state of the art: crashes a
- Page 36 and 37: Physical and mental characteristics
- Page 38 and 39: Physical and mental characteristics
- Page 40 and 41: Physical and mental characteristics
- Page 42 and 43: Physical and mental characteristics
- Page 44 and 45: Physical and mental characteristics
- Page 46 and 47: Strategies to improve the older dri
- Page 48 and 49: Strategies to improve the older dri
- Page 50 and 51: Strategies to improve the older dri
- Page 52 and 53: Strategies to improve the older dri
- Page 54 and 55: Theoretical framework to identify n
- Page 56 and 57: Theoretical framework to identify n
- Page 58 and 59: Theoretical framework to identify n
- Page 60 and 61: Theoretical framework to identify n
- Page 62 and 63: Theoretical framework to identify n
- Page 64 and 65: Theoretical framework to identify n
- Page 66 and 67: Theoretical framework to identify n
- Page 68 and 69: Theoretical framework to identify n
- Page 70 and 71: Theoretical framework to identify n
- Page 72 and 73: Theoretical framework to identify n
- Page 74 and 75: Theoretical framework to identify n
- Page 76 and 77:
Theoretical framework to identify n
- Page 78 and 79:
Intersection design and the older d
- Page 80 and 81:
Intersection design and the older d
- Page 82 and 83:
Intersection design and the older d
- Page 84 and 85:
Intersection design and the older d
- Page 86 and 87:
Intersection design and the older d
- Page 88 and 89:
Intersection design and the older d
- Page 90 and 91:
Intersection design and the older d
- Page 92 and 93:
Intersection design and the older d
- Page 94 and 95:
Intersection design and the older d
- Page 96 and 97:
Intersection design and the older d
- Page 98 and 99:
Intersection design and the older d
- Page 100 and 101:
Intersection design and the older d
- Page 102 and 103:
Intersection design and the older d
- Page 104 and 105:
Effects of intersection design on w
- Page 106 and 107:
Effects of intersection design on w
- Page 108 and 109:
Effects of intersection design on w
- Page 110 and 111:
Effects of intersection design on w
- Page 112 and 113:
Effects of intersection design on w
- Page 114 and 115:
Effects of intersection design on w
- Page 116 and 117:
Effects of intersection design on w
- Page 118 and 119:
Effects of intersection design on w
- Page 120 and 121:
Effects of intersection design on w
- Page 122 and 123:
Effects of intersection design on w
- Page 124 and 125:
Effects of intersection design on w
- Page 126 and 127:
Effects of intersection design on w
- Page 128 and 129:
Effects of intersection design on w
- Page 130 and 131:
Effects of intersection design on w
- Page 132 and 133:
Effects of intersection design on w
- Page 134 and 135:
Advanced driver assistance systems
- Page 136 and 137:
Advanced driver assistance systems
- Page 138 and 139:
Advanced driver assistance systems
- Page 140 and 141:
Advanced driver assistance systems
- Page 142 and 143:
Advanced driver assistance systems
- Page 144 and 145:
Advanced driver assistance systems
- Page 146 and 147:
Advanced driver assistance systems
- Page 148 and 149:
Advanced driver assistance systems
- Page 150 and 151:
Advanced driver assistance systems
- Page 152 and 153:
Advanced driver assistance systems
- Page 154 and 155:
Effects of a driver support system
- Page 156 and 157:
Effects of a driver support system
- Page 158 and 159:
Effects of a driver support system
- Page 160 and 161:
Effects of a driver support system
- Page 162 and 163:
Effects of a driver support system
- Page 164 and 165:
Effects of a driver support system
- Page 166 and 167:
Effects of a driver support system
- Page 168 and 169:
Effects of a driver support system
- Page 170 and 171:
Effects of a driver support system
- Page 172 and 173:
Effects of a driver support system
- Page 174 and 175:
Effects of a driver support system
- Page 176 and 177:
Effects of a driver support system
- Page 178 and 179:
Effects of a driver support system
- Page 180 and 181:
Effects of a driver support system
- Page 182 and 183:
Effects of a driver support system
- Page 184 and 185:
Effects of a driver support system
- Page 186 and 187:
Effects of a driver support system
- Page 188 and 189:
Effects of a driver support system
- Page 190 and 191:
Effects of a driver support system
- Page 192 and 193:
Effects of a driver support system
- Page 194 and 195:
Summary, discussion and general con
- Page 196 and 197:
Summary, discussion and general con
- Page 198 and 199:
Summary, discussion and general con
- Page 200 and 201:
Summary, discussion and general con
- Page 202 and 203:
Summary, discussion and general con
- Page 204 and 205:
Summary, discussion and general con
- Page 206 and 207:
Summary, discussion and general con
- Page 208 and 209:
Summary, discussion and general con
- Page 210 and 211:
Summary, discussion and general con
- Page 212 and 213:
Summary, discussion and general con
- Page 214:
Summary, discussion and general con
- Page 217 and 218:
Assisting the older driver Bekiaris
- Page 219 and 220:
Assisting the older driver (Eds.),
- Page 221 and 222:
Assisting the older driver Plaines,
- Page 223 and 224:
Assisting the older driver way driv
- Page 225 and 226:
Assisting the older driver Barcelon
- Page 227 and 228:
Assisting the older driver Guerrier
- Page 229 and 230:
Assisting the older driver Center.
- Page 231 and 232:
Assisting the older driver Kennedy,
- Page 233 and 234:
Assisting the older driver Marottol
- Page 235 and 236:
Assisting the older driver Moe, D.
- Page 237 and 238:
Assisting the older driver Quilter,
- Page 239 and 240:
Assisting the older driver Smiley,
- Page 241 and 242:
Assisting the older driver Van Wins
- Page 243 and 244:
Assisting the older driver Withaar,
- Page 245 and 246:
Assisting the older driver Appendix
- Page 248 and 249:
Samenvatting Samenvatting Dit proef
- Page 250 and 251:
Samenvatting Verkeersveiligheidsmaa
- Page 252 and 253:
Samenvatting jongere automobilisten
- Page 254 and 255:
Samenvatting voordeel dat ze de rij
- Page 256 and 257:
Dankwoord Dankwoord Het schrijven v
- Page 258:
Curriculum Vitae Curriculum Vitae R
- Page 261:
Assisting the older driver Nottingh