Assisting the older driver - SWOV
Assisting the older driver - SWOV
Assisting the older driver - SWOV

You also want an ePaper? Increase the reach of your titles
YUMPU automatically turns print PDFs into web optimized ePapers that Google loves.
<strong>Assisting</strong> <strong>the</strong> <strong>older</strong> <strong>driver</strong><br />
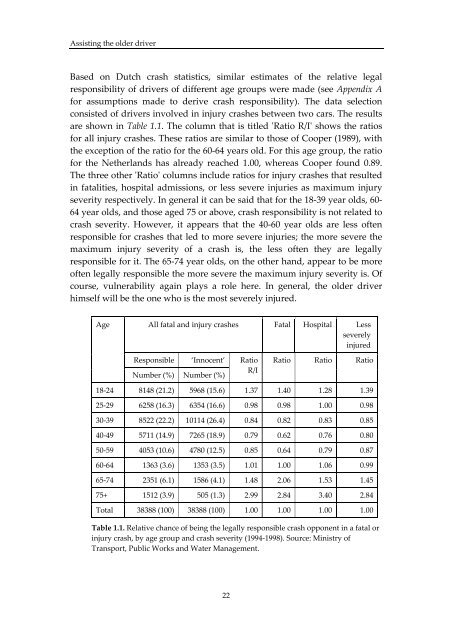
Based on Dutch crash statistics, similar estimates of <strong>the</strong> relative legal<br />
responsibility of <strong>driver</strong>s of different age groups were made (see Appendix A<br />
for assumptions made to derive crash responsibility). The data selection<br />
consisted of <strong>driver</strong>s involved in injury crashes between two cars. The results<br />
are shown in Table 1.1. The column that is titled ʹRatio R/Iʹ shows <strong>the</strong> ratios<br />
for all injury crashes. These ratios are similar to those of Cooper (1989), with<br />
<strong>the</strong> exception of <strong>the</strong> ratio for <strong>the</strong> 60‐64 years old. For this age group, <strong>the</strong> ratio<br />
for <strong>the</strong> Ne<strong>the</strong>rlands has already reached 1.00, whereas Cooper found 0.89.<br />
The three o<strong>the</strong>r ʹRatioʹ columns include ratios for injury crashes that resulted<br />
in fatalities, hospital admissions, or less severe injuries as maximum injury<br />
severity respectively. In general it can be said that for <strong>the</strong> 18‐39 year olds, 60‐<br />
64 year olds, and those aged 75 or above, crash responsibility is not related to<br />
crash severity. However, it appears that <strong>the</strong> 40‐60 year olds are less often<br />
responsible for crashes that led to more severe injuries; <strong>the</strong> more severe <strong>the</strong><br />
maximum injury severity of a crash is, <strong>the</strong> less often <strong>the</strong>y are legally<br />
responsible for it. The 65‐74 year olds, on <strong>the</strong> o<strong>the</strong>r hand, appear to be more<br />
often legally responsible <strong>the</strong> more severe <strong>the</strong> maximum injury severity is. Of<br />
course, vulnerability again plays a role here. In general, <strong>the</strong> <strong>older</strong> <strong>driver</strong><br />
himself will be <strong>the</strong> one who is <strong>the</strong> most severely injured.<br />
Age<br />
All fatal and injury crashes Fatal Hospital Less<br />
severely<br />
injured<br />
Responsible<br />
‘Innocent’<br />
Number (%) Number (%)<br />
Ratio<br />
R/I<br />
Ratio Ratio Ratio<br />
18‐24 8148 (21.2) 5968 (15.6) 1.37 1.40 1.28 1.39<br />
25‐29 6258 (16.3) 6354 (16.6) 0.98 0.98 1.00 0.98<br />
30‐39 8522 (22.2) 10114 (26.4) 0.84 0.82 0.83 0.85<br />
40‐49 5711 (14.9) 7265 (18.9) 0.79 0.62 0.76 0.80<br />
50‐59 4053 (10.6) 4780 (12.5) 0.85 0.64 0.79 0.87<br />
60‐64 1363 (3.6) 1353 (3.5) 1.01 1.00 1.06 0.99<br />
65‐74 2351 (6.1) 1586 (4.1) 1.48 2.06 1.53 1.45<br />
75+ 1512 (3.9) 505 (1.3) 2.99 2.84 3.40 2.84<br />
Total 38388 (100) 38388 (100) 1.00 1.00 1.00 1.00<br />
Table 1.1. Relative chance of being <strong>the</strong> legally responsible crash opponent in a fatal or<br />
injury crash, by age group and crash severity (1994‐1998). Source: Ministry of<br />
Transport, Public Works and Water Management.<br />
22