Assisting the older driver - SWOV
Assisting the older driver - SWOV
Assisting the older driver - SWOV

You also want an ePaper? Increase the reach of your titles
YUMPU automatically turns print PDFs into web optimized ePapers that Google loves.
<strong>Assisting</strong> <strong>the</strong> <strong>older</strong> <strong>driver</strong><br />
patterns of interaction among <strong>the</strong> participants in <strong>the</strong> traffic system. As a<br />
result, <strong>the</strong> increasing participation of <strong>older</strong> <strong>driver</strong>s in traffic may lower <strong>the</strong><br />
crash rates for <strong>older</strong> <strong>driver</strong>s (OECD, 2001).<br />
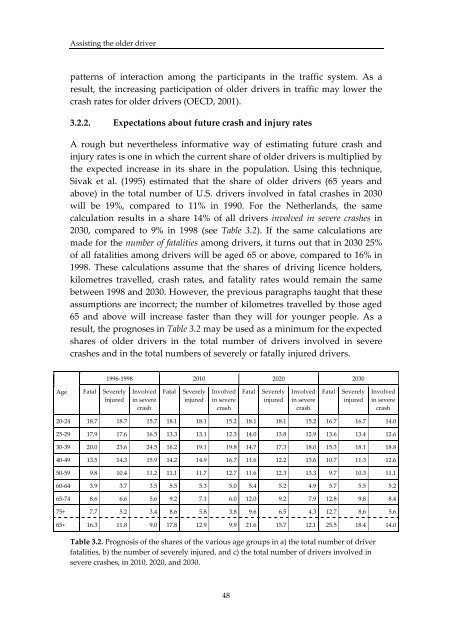
3.2.2. Expectations about future crash and injury rates<br />
A rough but never<strong>the</strong>less informative way of estimating future crash and<br />
injury rates is one in which <strong>the</strong> current share of <strong>older</strong> <strong>driver</strong>s is multiplied by<br />
<strong>the</strong> expected increase in its share in <strong>the</strong> population. Using this technique,<br />
Sivak et al. (1995) estimated that <strong>the</strong> share of <strong>older</strong> <strong>driver</strong>s (65 years and<br />
above) in <strong>the</strong> total number of U.S. <strong>driver</strong>s involved in fatal crashes in 2030<br />
will be 19%, compared to 11% in 1990. For <strong>the</strong> Ne<strong>the</strong>rlands, <strong>the</strong> same<br />
calculation results in a share 14% of all <strong>driver</strong>s involved in severe crashes in<br />
2030, compared to 9% in 1998 (see Table 3.2). If <strong>the</strong> same calculations are<br />
made for <strong>the</strong> number of fatalities among <strong>driver</strong>s, it turns out that in 2030 25%<br />
of all fatalities among <strong>driver</strong>s will be aged 65 or above, compared to 16% in<br />
1998. These calculations assume that <strong>the</strong> shares of driving licence h<strong>older</strong>s,<br />
kilometres travelled, crash rates, and fatality rates would remain <strong>the</strong> same<br />
between 1998 and 2030. However, <strong>the</strong> previous paragraphs taught that <strong>the</strong>se<br />
assumptions are incorrect; <strong>the</strong> number of kilometres travelled by those aged<br />
65 and above will increase faster than <strong>the</strong>y will for younger people. As a<br />
result, <strong>the</strong> prognoses in Table 3.2 may be used as a minimum for <strong>the</strong> expected<br />
shares of <strong>older</strong> <strong>driver</strong>s in <strong>the</strong> total number of <strong>driver</strong>s involved in severe<br />
crashes and in <strong>the</strong> total numbers of severely or fatally injured <strong>driver</strong>s.<br />
1996‐1998 2010 2020 2030<br />
Age Fatal Severely<br />
injured<br />
Involved<br />
in severe<br />
crash<br />
Fatal<br />
Severely<br />
injured<br />
Involved<br />
in severe<br />
crash<br />
Fatal<br />
Severely<br />
injured<br />
Involved<br />
in severe<br />
crash<br />
Fatal<br />
Severely<br />
injured<br />
Involved<br />
in severe<br />
crash<br />
20‐24 18.7 18.7 15.7 18.1 18.1 15.2 18.1 18.1 15.2 16.7 16.7 14.0<br />
25‐29 17.9 17.6 16.5 13.3 13.1 12.3 14.0 13.8 12.9 13.6 13.4 12.6<br />
30‐39 20.0 23.6 24.5 16.2 19.1 19.8 14.7 17.3 18.0 15.3 18.1 18.8<br />
40‐49 13.5 14.3 15.9 14.2 14.9 16.7 11.6 12.2 13.6 10.7 11.3 12.6<br />
50‐59 9.8 10.4 11.2 11.1 11.7 12.7 11.6 12.3 13.3 9.7 10.3 11.1<br />
60‐64 3.9 3.7 3.5 5.5 5.3 5.0 5.4 5.2 4.9 5.7 5.5 5.2<br />
65‐74 8.6 6.6 5.6 9.2 7.1 6.0 12.0 9.2 7.9 12.8 9.8 8.4<br />
75+ 7.7 5.2 3.4 8.6 5.8 3.8 9.6 6.5 4.3 12.7 8.6 5.6<br />
65+ 16.3 11.8 9.0 17.8 12.9 9.9 21.6 15.7 12.1 25.5 18.4 14.0<br />
Table 3.2. Prognosis of <strong>the</strong> shares of <strong>the</strong> various age groups in a) <strong>the</strong> total number of <strong>driver</strong><br />
fatalities, b) <strong>the</strong> number of severely injured, and c) <strong>the</strong> total number of <strong>driver</strong>s involved in<br />
severe crashes, in 2010, 2020, and 2030.<br />
48