SEEU Review vol. 5 Nr. 2 (pdf) - South East European University
SEEU Review vol. 5 Nr. 2 (pdf) - South East European University
SEEU Review vol. 5 Nr. 2 (pdf) - South East European University

You also want an ePaper? Increase the reach of your titles
YUMPU automatically turns print PDFs into web optimized ePapers that Google loves.
<strong>SEEU</strong> <strong>Review</strong> Volume 5, No. 2, 2009<br />
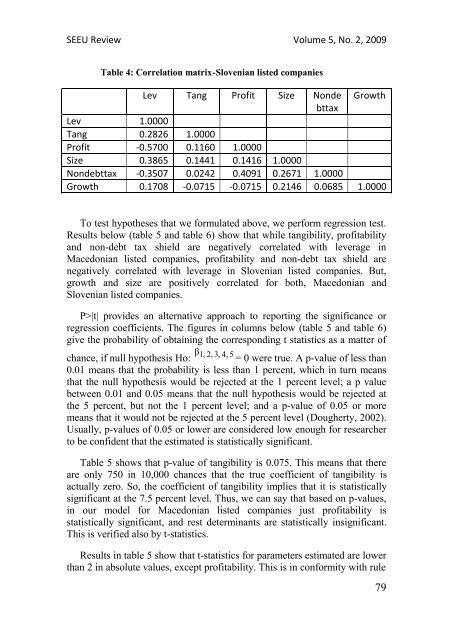
Table 4: Correlation matrix-Slovenian listed companies<br />
Lev Tang Profit Size Nonde Growth<br />
bttax<br />
Lev 1.0000<br />
Tang 0.2826 1.0000<br />
Profit -0.5700 0.1160 1.0000<br />
Size 0.3865 0.1441 0.1416 1.0000<br />
Nondebttax -0.3507 0.0242 0.4091 0.2671 1.0000<br />
Growth 0.1708 -0.0715 -0.0715 0.2146 0.0685 1.0000<br />
To test hypotheses that we formulated above, we perform regression test.<br />
Results below (table 5 and table 6) show that while tangibility, profitability<br />
and non-debt tax shield are negatively correlated with leverage in<br />
Macedonian listed companies, profitability and non-debt tax shield are<br />
negatively correlated with leverage in Slovenian listed companies. But,<br />
growth and size are positively correlated for both, Macedonian and<br />
Slovenian listed companies.<br />
P>|t| provides an alternative approach to reporting the significance or<br />
regression coefficients. The figures in columns below (table 5 and table 6)<br />
give the probability of obtaining the corresponding t statistics as a matter of<br />
β 1,<br />
2, 3, 4, 5<br />
chance, if null hypothesis Ho: = 0 were true. A p-value of less than<br />
0.01 means that the probability is less than 1 percent, which in turn means<br />
that the null hypothesis would be rejected at the 1 percent level; a p value<br />
between 0.01 and 0.05 means that the null hypothesis would be rejected at<br />
the 5 percent, but not the 1 percent level; and a p-value of 0.05 or more<br />
means that it would not be rejected at the 5 percent level (Dougherty, 2002).<br />
Usually, p-values of 0.05 or lower are considered low enough for researcher<br />
to be confident that the estimated is statistically significant.<br />
Table 5 shows that p-value of tangibility is 0.075. This means that there<br />
are only 750 in 10,000 chances that the true coefficient of tangibility is<br />
actually zero. So, the coefficient of tangibility implies that it is statistically<br />
significant at the 7.5 percent level. Thus, we can say that based on p-values,<br />
in our model for Macedonian listed companies just profitability is<br />
statistically significant, and rest determinants are statistically insignificant.<br />
This is verified also by t-statistics.<br />
Results in table 5 show that t-statistics for parameters estimated are lower<br />
than 2 in absolute values, except profitability. This is in conformity with rule<br />
79