SEEU Review vol. 5 Nr. 2 (pdf) - South East European University
SEEU Review vol. 5 Nr. 2 (pdf) - South East European University
SEEU Review vol. 5 Nr. 2 (pdf) - South East European University

You also want an ePaper? Increase the reach of your titles
YUMPU automatically turns print PDFs into web optimized ePapers that Google loves.
<strong>SEEU</strong> <strong>Review</strong> Volume 5, No. 2, 2009<br />
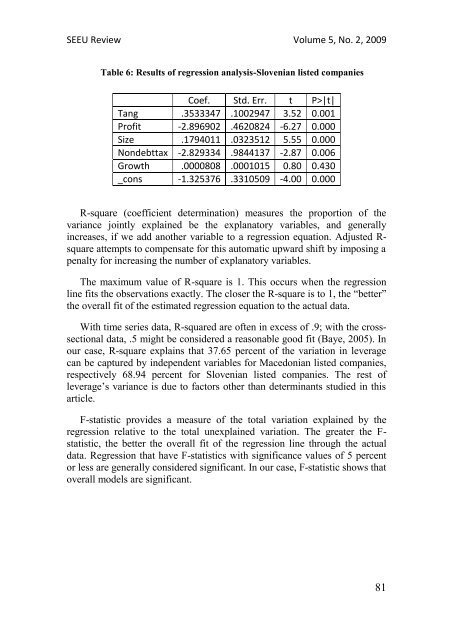
Table 6: Results of regression analysis-Slovenian listed companies<br />
Coef. Std. Err. t P>|t|<br />
Tang .3533347 .1002947 3.52 0.001<br />
Profit -2.896902 .4620824 -6.27 0.000<br />
Size .1794011 .0323512 5.55 0.000<br />
Nondebttax -2.829334 .9844137 -2.87 0.006<br />
Growth .0000808 .0001015 0.80 0.430<br />
_cons -1.325376 .3310509 -4.00 0.000<br />
R-square (coefficient determination) measures the proportion of the<br />
variance jointly explained be the explanatory variables, and generally<br />
increases, if we add another variable to a regression equation. Adjusted R-<br />
square attempts to compensate for this automatic upward shift by imposing a<br />
penalty for increasing the number of explanatory variables.<br />
The maximum value of R-square is 1. This occurs when the regression<br />
line fits the observations exactly. The closer the R-square is to 1, the “better”<br />
the overall fit of the estimated regression equation to the actual data.<br />
With time series data, R-squared are often in excess of .9; with the crosssectional<br />
data, .5 might be considered a reasonable good fit (Baye, 2005). In<br />
our case, R-square explains that 37.65 percent of the variation in leverage<br />
can be captured by independent variables for Macedonian listed companies,<br />
respectively 68.94 percent for Slovenian listed companies. The rest of<br />
leverage’s variance is due to factors other than determinants studied in this<br />
article.<br />
F-statistic provides a measure of the total variation explained by the<br />
regression relative to the total unexplained variation. The greater the F-<br />
statistic, the better the overall fit of the regression line through the actual<br />
data. Regression that have F-statistics with significance values of 5 percent<br />
or less are generally considered significant. In our case, F-statistic shows that<br />
overall models are significant.<br />
81