3071-The political economy of new slavery
3071-The political economy of new slavery
3071-The political economy of new slavery
You also want an ePaper? Increase the reach of your titles
YUMPU automatically turns print PDFs into web optimized ePapers that Google loves.
Jeroen Doomernik 39<br />
to have a country where they k<strong>new</strong> themselves to be welcome. 3<br />
For many other prospective or actual migrants this was very different.<br />
As a result, the number <strong>of</strong> asylum seekers increased rapidly. To them<br />
applying for asylum was the only feasible way to get a foot in the door,<br />
regardless <strong>of</strong> whether they were in need <strong>of</strong> protection or not.<br />
During the mid-1980s, the numbers <strong>of</strong> migrants asking for asylum in<br />
Europe fluctuated between 150,000 and 200,000 annually. By the end <strong>of</strong><br />
that decade, their numbers started to rise and reached 400,000 in 1990.<br />
In 1992 they reached 676,000, two-thirds <strong>of</strong> the claims being filed in<br />
Germany alone. Many <strong>of</strong> those applications were unsuccessful in that<br />
they did not lead to a permanent residence permit, be it as a Convention<br />
refugee 4 or because <strong>of</strong> less specific humanitarian considerations.<br />
This does not mean, however, that these migrants did not settle. <strong>The</strong>re<br />
were those who found alternative means <strong>of</strong> getting a residence permit<br />
(for example, through marriage, a work permit, as a student, and so on),<br />
were tolerated (currently Germany is host to half a million <strong>of</strong> such<br />
aliens) or simply remained in an undocumented state. Of the latter we,<br />
obviously, have no figures. Other immigrants too, are not always easily<br />
enumerated, especially not if figures for different countries are to be<br />
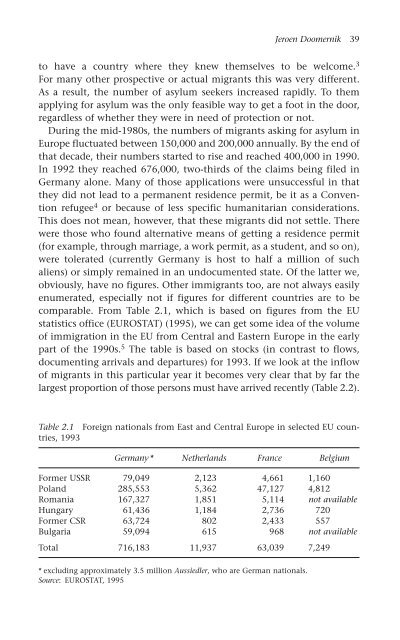
comparable. From Table 2.1, which is based on figures from the EU<br />
statistics <strong>of</strong>fice (EUROSTAT) (1995), we can get some idea <strong>of</strong> the volume<br />
<strong>of</strong> immigration in the EU from Central and Eastern Europe in the early<br />
part <strong>of</strong> the 1990s. 5 <strong>The</strong> table is based on stocks (in contrast to flows,<br />
documenting arrivals and departures) for 1993. If we look at the inflow<br />
<strong>of</strong> migrants in this particular year it becomes very clear that by far the<br />
largest proportion <strong>of</strong> those persons must have arrived recently (Table 2.2).<br />
Table 2.1 Foreign nationals from East and Central Europe in selected EU countries,<br />
1993<br />
Germany* Netherlands France Belgium<br />
Former USSR 79,049 2,123 4,661 1,160<br />
Poland 285,553 5,362 47,127 4,812<br />
Romania 167,327 1,851 5,114 not available<br />
Hungary 61,436 1,184 2,736 720<br />
Former CSR 63,724 802 2,433 557<br />
Bulgaria 59,094 615 968 not available<br />
Total 716,183 11,937 63,039 7,249<br />
* excluding approximately 3.5 million Aussiedler, who are German nationals.<br />
Source: EUROSTAT, 1995


